. 2025 Apr 4;22(1):100.
doi: 10.1186/s12974-025-03431-5.

Fucoidan reduces NET accumulation and alleviates chemotherapy-induced peripheral neuropathy via the gut-blood-DRG axis

Affiliations

Fucoidan reduces NET accumulation and alleviates chemotherapy-induced peripheral neuropathy via the gut-blood-DRG axis

Rumeng Jia et al. J Neuroinflammation. .

Abstract

Background: Chemotherapy-induced peripheral neuropathy (CIPN) is a serious adverse reaction to chemotherapy with limited treatment options. Research has indicated that neutrophil extracellular traps (NETs) are critical for the pathogenesis of CIPN. LPS/HMGB1 serve as important inducers of NETs. Here, we aimed to target the inhibition of NET formation (NETosis) to alleviate CIPN.

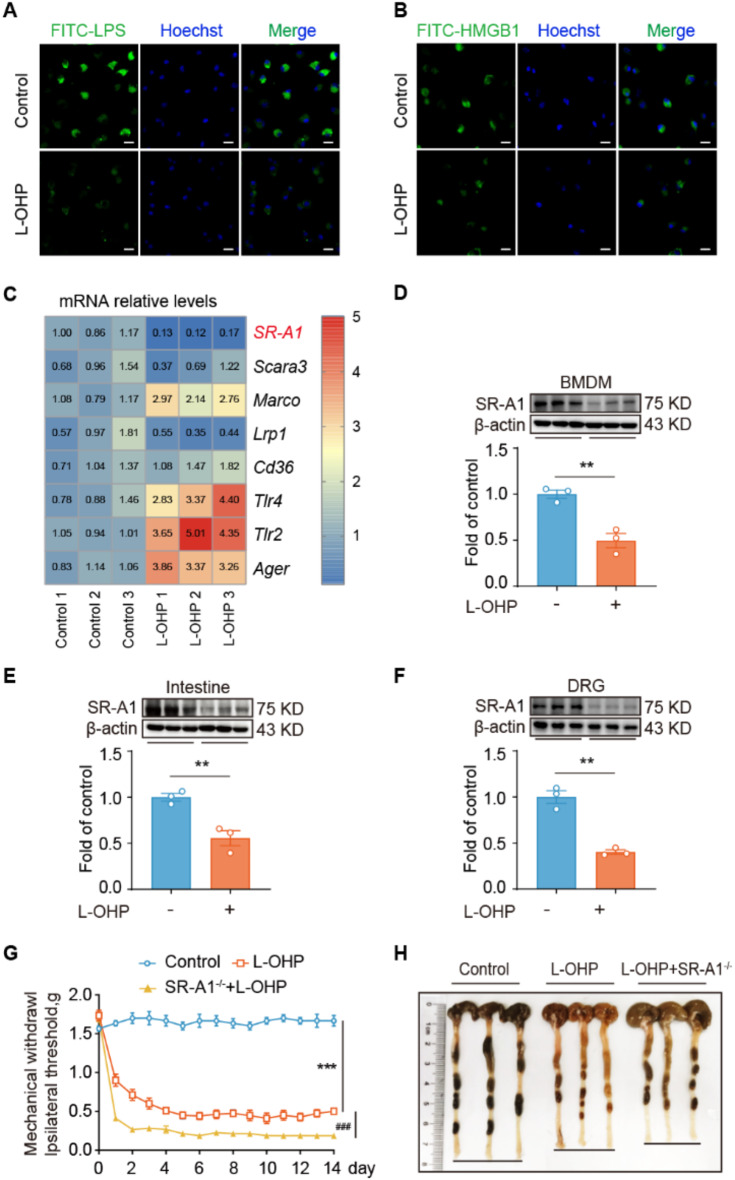
Methods: Oxaliplatin (L-OHP) was used to establish a CIPN model. The mice were pretreated with fucoidan to investigate the therapeutic effect. SR-A1-/- mice were used to examine the role of scavenger receptor A1 (SR-A1) in CIPN. Bone marrow-derived macrophages (BMDMs) isolated from SR-A1-/- mice and WT mice were used to investigate the mechanism by which macrophage phagocytosis of NETs alleviates CIPN.

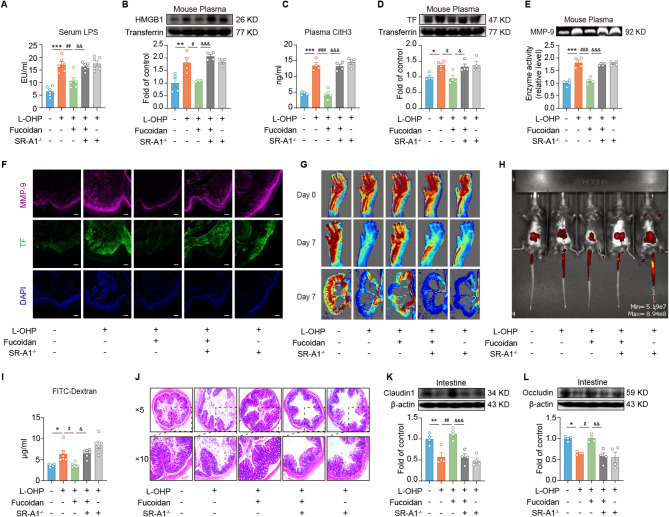
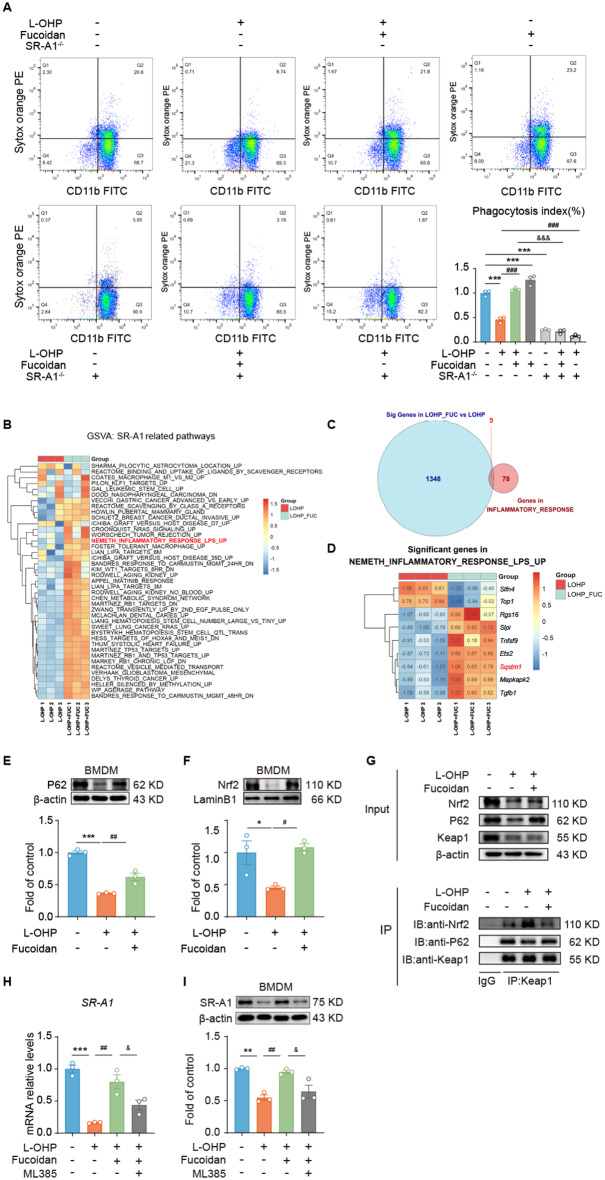
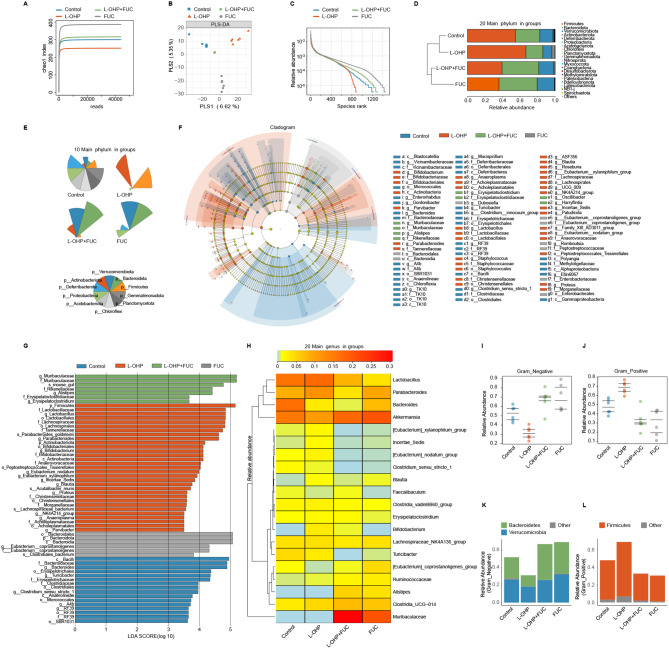
Results: Clinically, we found that the contents of LPS, HMGB1 and NETs in the plasma of CIPN patients were significantly increased and positively correlated with the VAS score. Fucoidan decreased the LPS/HMGB1/NET contents and relieved CIPN in mice. Mechanistically, fucoidan upregulated SR-A1 expression and promoted the phagocytosis of LPS/HMGB1 by BMDMs. Fucoidan also facilitated the engulfment of NETs by BMDMs via the recognition and localization of SR-A1 and HMGB1. The therapeutic effects of fucoidan were abolished by SR-A1 knockout. RNA-seq analysis revealed that fucoidan increased sqstm1 (p62) gene expression. Fucoidan promoted the competitive binding of sqstm1 and Nrf2 to Keap1, increasing Nrf2 nuclear translocation and SR-A1 transcription. Additionally, the sequencing analysis (16 S) of microbial diversity revealed that fucoidan increased the gut microbiota diversity and abundance and increased the Bacteroides/Firmicutes ratio.

Conclusions: Altogether, fucoidan promotes the SR-A1-mediated phagocytosis of LPS/HMGB1/NETs and maintains gut microbial homeostasis, which may provide a potential therapeutic strategy for CIPN.

Keywords: CIPN; Fucoidan; Gut; Macrophage; NETs; SR-A1.


Conflict of interest statement

Declarations. Ethics approval and consent to participate: The study was reviewed and approved by the Nanjing First Hospital Institutional Review Committee with ethics number KY20171228-KS-01. All experimental methods were conducted in accordance with relevant guidelines and regulations. The experimental plan involving animals was approved by the Committee of Experimental Animal Ethics of Nanjing Medical University through the “Examination of Ethical Welfare of Experimental Animals” and complies with relevant national welfare ethics provisions for experimental animals. The approval number is IACUC-2011040. Consent for publication: Not applicable. Competing interests: The authors declare no competing interests.

Figures

Fig. 1
Fig. 1
CIPN is accompanied by the excessive accumulation of LPS/HMGB1/NETs in the blood and microcirculation disorders. (A) ELISA was used to detect the content of H3Cit in the plasma of patients with tumours before chemotherapy (control) and after chemotherapy (CIPN) (n = 20). (B) After the last chemotherapy session, the correlation between the plasma H3Cit concentration and VAS score of CIPN patients was investigated (n = 20). (C) western blotting was performed to detect the content of TF in the plasma of patients with tumours before and after chemotherapy (n = 10). (D) (E) Investigation of hand blood flow in patients with tumours before chemotherapy and at 7, 21 and 35 days after chemotherapy by laser Doppler imaging (n = 10). (F) A gelatine zymogram was used to investigate the activity of MMP9 in the plasma of patients with tumours before and after chemotherapy (n = 10). (G) (I) ELISAs were used to detect the contents of LPS and HMGB1 in the plasma of patients with tumours before chemotherapy (control) and after chemotherapy (CIPN) (n = 20). (H) (J) After the last chemotherapy session, the correlations between the plasma LPS/HMGB1 concentrations and the VAS scores of CIPN patients were investigated (n = 20). Significant differences were determined using unpaired Student’s t tests (A, B, C, F, G and I), one-way ANOVA (E) or linear regression analysis (B, H and J) (*p < 0.05, **p < 0.01 and ***p < 0.001 compared with the control group)
Fig. 2
Fig. 2
L-OHP caused LPS/HMGB1/NET accumulation and microcirculatory disturbances in CIPN mice. (A) A CIPN model was established via the administration of L-OHP (3 mg/kg, i.p.) for 5 days. The mechanical pain threshold was detected in mice using the Von Frey test (n = 6). (B) (C) The plasma and DRGs of the mice were collected on the 10th day after the first injection of L-OHP. The H3Cit content was detected by ELISA (n = 4). (D) Immunofluorescence staining was performed to evaluate the expression of H3Cit in DRGs (n = 3). Scale bar: 20 μm. (E) The TF levels in plasma were detected by western blotting (n = 3). (F) (G) (H) The plantar microcirculatory condition and intestinal microcirculatory condition of the mice were investigated by laser Doppler imaging (n = 4). (I) The activity of MMP9 in mouse plasma was detected by gelatine zymography (n = 3). (J) (K) The content of LPS in the plasma and DRGs was detected via ELISA (n = 6). (L) The intestinal tracts of the mice were fixed with 4% paraformaldehyde and subjected to HE staining (n = 3). (M) On the 10th day after the first injection of L-OHP, FITC-dextran (600 mg/kg, i.g.) was administered to the mice. Four hours later, the serum of the mice was collected, and the concentration of FITC-dextran in the serum was detected using an enzyme labelling instrument (n = 6). (N) HMGB1 expression in the plasma of the mice was detected by western blotting (n = 3). Significant differences were determined using unpaired Student’s t tests (B, C, E, G, H-K, M and N) or two-way ANOVA (A). (*p < 0.05, **p < 0.01 and ***p < 0.001 compared with the control group)
Fig. 3
Fig. 3
Dysfunction of SR-A1-mediated LPS/HMGB1 scavenging by macrophages induced CIPN. (A) BMDMs were collected from WT mice and stimulated with L-OHP (5 µM) for 12 h. FITC-LPS (100 µg/ml) was added. The phagocytosis of FITC-LPS by BMDMs was observed under a confocal microscope (n = 3). Scale bar = 20 μm. The above conditions were repeated, and FITC-HMGB1 (10 nM) was added to observe its phagocytosis by BMDMs (B) (n = 3). Scale bar: 20 μm. (C) After BMDMs were obtained from WT mice and stimulated with L-OHP (5 µM) for 18 h, total RNA was extracted, and the mRNA levels of SR-A1, Scara3, Marco, LRP1, CD36, TLR4, TLR2, and RAGE were detected by qPCR (n = 3). (D) BMDMs were obtained from WT mice and stimulated with L-OHP (5 µM) for 18 h. The cells were collected, and the expression of SR-A1 was detected by western blotting (n = 3). The intestinal tract (E) and DRGs (F) of the mice were collected to investigate the expression level of SR-A1 (n = 3). (G) WT mice and SR-A1−/− mice were administered L-OHP (1.5 mg/kg, i.p.) for 5 days to establish a CIPN model. The Von Frey test was performed to detect the mechanical pain threshold of the mice (n = 6). (H) The intact colons of the mice were collected, and the colon lengths of the different treatment groups were compared (n = 6). Significant differences were determined using unpaired Student’s t test (C-F) or two-way ANOVA (G). (*p < 0.05, **p < 0.01 and ***p < 0.001 compared with the control group)
Fig. 4
Fig. 4
Fucoidan upregulated macrophage SR-A1 expression to alleviate CIPN. (A) (B) The cells were collected, and the expression of SR-A1 was detected by western blotting (n = 3). (C) (D) The phagocytosis of FITC-LPS and FITC-HMGB1 by BMDMs was observed under a confocal microscope (n = 3). Scale bar: 20 μm. (E) A mouse CIPN model was established, and the mechanical pain threshold (n = 6) was detected via the Von Frey test. (F) On the 10th day after the first injection of L-OHP, the intestinal tracts of the mice were collected to investigate the expression level of SR-A1 in the intestinal tissue by western blotting (n = 4). (G) DRGs were collected from the mice to investigate the expression level of SR-A1 (n = 4). (H) (I) The content of LPS in the serum and DRGs was detected by ELISA (n = 6). (J) Mouse plasma was collected to detect HMGB1 levels (n = 4). (K) (L) The H3Cit contents in the plasma and DRGs were detected by ELISA (n = 4). (M) The levels of TF in the plasma of the mice was detected by western blotting (n = 4). The plantar and intestinal microcirculation of the mice was measured by laser Doppler imaging (n = 4). The differences in plantar blood flow (N) (O) and intestinal blood flow (P) (Q) between the different groups were determined (n = 4). (R) The activity of MMP9 in the plasma of mice was detected by gelatine zymography (n = 4). (S) FITC-dextran (600 mg/kg, i.g.) was administered on the 10th day after the first injection of L-OHP into the mice. Four hours later, the intestinal leakage of the mice was investigated by illumination with visible light in vivo. (T) The serum of the mice was collected, and the concentration of FITC-dextran in the serum was detected using an enzyme-labelling instrument (n = 6). Significant differences were determined using one-way ANOVA (BM, O, Q, R and T) or two-way ANOVA (E). (*p < 0.05, **p < 0.01 and ***p < 0.001 compared with the control group; #p < 0.05, ##p < 0.01 and ###p < 0.001 compared with the L-OHP group)
Fig. 5
Fig. 5
SR-A1 plays a key role in the treatment of CIPN with fucoidan. (A) (B) BMDMs were obtained from SR-A1−/− mice and WT mice. The phagocytosis of FITC-LPS and FITC-HMGB1 by BMDMs was observed under a confocal microscope (n = 3). (FITC-LPS: scale bar: 20 μm; FITC-HMGB1: scale bar: 40 μm). (C) Cellular proteins were collected, and western blotting was used to investigate the phagocytosis of His tag-HMGB1 (10 nM) by BMDMs in different groups (n = 3). (D) WT mice and SR-A1−/− mice were administered fucoidan (200 mg/kg, I.G.) 7 days in advance, and then L-OHP (3 mg/kg, i.p.) was administered to the mice for 5 days to establish the CIPN model. The mechanical pain threshold in mice was detected using the Von Frey test (n = 6). (E) (F) The DRGs of the mice were collected, and the contents of LPS (n = 6) and H3Cit (n = 4) were detected by ELISAs. (G) Immunofluorescence staining was performed to evaluate the expression of H3Cit in DRGs (n = 3, scale bar: 20 μm). TF expression levels (H), HIF-1α protein expression levels (I) and MMP9 protein expression levels (J) in the mouse DRGs were detected by western blotting (n = 4). (K) Demyelination of the sciatic nerve in response to different treatment components was investigated by transmission electron microscopy (n = 3). Significant differences were determined using one-way ANOVA (C, E, F, H, I and J) or two-way ANOVA (D). (*p < 0.05, **p < 0.01 and ***p < 0.001 compared with the control group; #p < 0.05, ##p < 0.01 and ###p < 0.001 compared with the L-OHP group; &p < 0.05, &&p < 0.01 and &&&p < 0.001 compared with the L-OHP + fucoidan group)
Fig. 6
Fig. 6
SR-A1 plays a key role in the treatment of CIPN with fucoidan. (A) The serum of the mice was collected to detect the LPS content via ELISA (n = 6). (B) (C) Plasma was collected to detect the levels of HMGB1 (n = 4) and H3Cit (n = 4). (D) TF expression and MMP9 activity (E) were investigated (n = 4). (F) The TF/MMP9 ratio in the feet of the mice was qualitatively investigated by immunofluorescence staining (n = 3). Scale bar: 50 μm. (G) Laser Doppler imaging was used to investigate the microcirculatory status of the plantar surface and intestinal tracts in mice (n = 4). (H) FITC-dextran was administered to the mice for four hours, and intestinal leakage was investigated by illumination with visible light. (I) The serum of the mice was collected, and the concentration of FITC-dextran was detected using an enzyme labelling instrument (n = 6). (J) The intestines of the mice were collected, fixed with 4% paraformaldehyde, and stained with HE (n = 3). Claudin-1 protein (K) and Occludin protein (L) levels in the intestinal tract of the mice were detected via western blotting (n = 4). Significant differences were determined using one-way ANOVA (A-C, E, F, J, L and M). (*p < 0.05, **p < 0.01 and ***p < 0.001 compared with the control group; #p < 0.05, ##p < 0.01 and ###p < 0.001 compared with the L-OHP group; &p < 0.05, &&p < 0.01 and &&&p < 0.001 compared with the L-OHP + fucoidan group)
Fig. 7
Fig. 7
Fucoidan upregulates SR-A1 expression through the p62/Keap1/Nrf2 signalling pathway. (A) BMDMs were obtained from SR-A1−/− mice and WT mice. Fucoidan (250 µg/ml) was added to prestimulate the cells for 12 h, and then L-OHP (5 µM) was added and incubated for 12 h. NETs marked with SYTOX orange (500 ng/ml) were added, and the phagocytosis of NETs by BMDMs was detected using flow cytometry (n = 3). (B) BMDMs were obtained from WT mice, pretreated with fucoidan (250 µg/ml) for 12 h, and then stimulated with L-OHP (5 µM) for 12 h. The cells were collected for RNA-seq. SR-A1-related pathways were subjected to GSVA enrichment analysis. (C) (D) A total of 1357 genes were significantly different between the L-OHP group and the L-OHP + FUC group. Eighty-seven genes were involved in the “NEMETH_INFLAMMATORY_RESPONSE_LPS_UP” signalling pathway, 9 of which were significantly differentially expressed (n = 3). (E) The proteins were collected from cells stimulated with L-OHP (5 µM) for 18 h, and the expression of the p62 protein was detected by western blotting (n = 3). (F) Nuclear protein was collected, and Nrf2 protein levels were detected by western blotting (n = 3). (G) Cellular proteins were collected, and co-IP was used to verify the relationships among p62/Keap1/Nrf2. (H) BMDMs were pretreated with the Nrf2 inhibitor ML385 (10 µM), stimulated with fucoidan (250 µg/ml) for 12 h, and then stimulated with L-OHP (5 µM) for 18 h. Cells were collected, and qPCR was performed to detect the SR-A1 mRNA level (n = 3). (I) The SR-A1 protein expression level was detected via western blotting (n = 3). Significant differences were determined using one-way ANOVA (D-G and H). (*p < 0.05, **p < 0.01 and ***p < 0.001 compared with the control group; #p < 0.05, ##p < 0.01 and ###p < 0.001 compared with the L-OHP group; &p < 0.05, &&p < 0.01 and &&&p < 0.001 compared with the L-OHP + fucoidan group)
Fig. 8
Fig. 8
Fucoidan regulates the gut microbiota and alleviates CIPN by affecting the gut–nerve axis. (A) The Chao1 index was used to estimate the diversity of the gut microbiota. (B) Partial least squares-discriminant analysis (PLS-DA) was performed to analyse the beta diversity of the intestinal microbiota in the faeces from the four groups of mice. (C) Rank abundance curves were constructed to analyse the richness and evenness of species in the samples. (D) Clustering heatmap analysis of faecal phylum-level species showing the changes in the relative abundances in the top 20 phylum-level species in the faeces from the four groups of mice. (E) Phylum-level star analysis showing the changes in the relative abundances of the top 10 phyla in the faeces from the four groups of mice. (F) Linear discriminant analysis effect size (LEfSe) was used to display the evolutionary relationship of the entire species system, the distribution patterns of important species in different groups, and the distribution of the abundances of species with significant differences between groups (the LDA threshold was 3), as well as to identify the species with significant differences in the intestinal microbiota among all classification levels in the faeces from the four groups of mice. (G) The LDA threshold was 3.5. (H) Clustering heatmap analysis of the changes in the relative abundances of the top 20 genera in the faeces from the four groups of mice. (I) (J) An inter-group analysis of differences in phenotypic abundances can intuitively reflect the median, dispersion, maximum value, minimum value, and outliers of species diversity within each group. (K) (L) Phenotypic abundance reflects the relative abundance percentage of a species

References

    1. Brown TJ, Sedhom R, Gupta A. Chemotherapy-Induced peripheral neuropathy. JAMA Oncol. 2019;5:750. - PubMed
    1. Battaglini E, Goldstein D, Grimison P, McCullough S, Mendoza-Jones P, Park SB. Chemotherapy-Induced peripheral neurotoxicity in cancer survivors: predictors of Long-Term patient outcomes. J Natl Compr Canc Netw. 2021;19:821–8. - PubMed
    1. Loprinzi CL, Lacchetti C, Bleeker J, Cavaletti G, Chauhan C, Hertz DL, Kelley MR, Lavino A, Lustberg MB, Paice JA, et al. Prevention and management of Chemotherapy-Induced peripheral neuropathy in survivors of adult cancers: ASCO guideline update. J Clin Oncol. 2020;38:3325–48. - PubMed
    1. Hertz DL, Childs DS, Park SB, Faithfull S, Ke Y, Ali NT, McGlown SM, Chan A, Grech LB, Loprinzi CL, et al. Patient-centric decision framework for treatment alterations in patients with Chemotherapy-induced peripheral neuropathy (CIPN). Cancer Treat Rev. 2021;99:102241. - PubMed
    1. Lee KH, Kronbichler A, Park DD, Park Y, Moon H, Kim H, Choi JH, Choi Y, Shim S, Lyu IS, et al. Neutrophil extracellular traps (NETs) in autoimmune diseases: A comprehensive review. Autoimmun Rev. 2017;16:1160–73. - PubMed

MeSH terms