Metabolic profiling and early prediction models for gestational diabetes mellitus in PCOS and non-PCOS pregnant women
- PMID: 40186293
- PMCID: PMC11971856
- DOI: 10.1186/s40001-025-02526-2
Metabolic profiling and early prediction models for gestational diabetes mellitus in PCOS and non-PCOS pregnant women
Abstract
Background: Gestational diabetes mellitus (GDM) is the most common pregnancy complication, significantly affecting maternal and neonatal health. Polycystic ovary syndrome (PCOS) is a common endocrine disorder characterized by metabolic abnormalities, which notably elevates the risk of developing GDM during pregnancy.
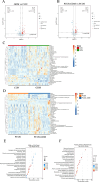
Methods: In this study, we utilized ultra-high-performance liquid chromatography for untargeted metabolomics analysis of serum samples from 137 pregnant women in the early-to-mid-pregnancy. The cohort consisted of 137 participants, including 70 in the PCOS group (36 who developed GDM in mid-to-late pregnancy and 34 who did not) and 67 in the non-PCOS group (37 who developed GDM and 30 who remained GDM-free). The aim was to investigate metabolic profile differences between PCOS and non-PCOS patients and to construct early GDM prediction models separately for the PCOS and non-PCOS groups.
Results: Our findings revealed significant differences in the metabolic profiles of PCOS patients, which may help elucidate the higher risk of GDM in the PCOS population. Moreover, tailored early GDM prediction models for the PCOS group demonstrated high predictive performance, providing strong support for early diagnosis and intervention in clinical practice.
Conclusions: Untargeted metabolomics analysis revealed distinct metabolic patterns between PCOS patients and non-PCOS patients, particularly in pathways related to GDM. Based on these findings, we successfully constructed GDM prediction models for both PCOS and non-PCOS groups, offering a promising tool for clinical management and early intervention in high-risk populations.
Keywords: Gestational diabetes mellitus; Polycystic ovary syndrome; Prediction models; Untargeted metabolomics analysis.
© 2025. The Author(s).
Conflict of interest statement
Declarations. Ethics approval and consent to participate: Ethics committee approval for this study was obtained from the ethics committee of Jinan Maternity and Child Care Hospital (study no: 2024 - 1- 011). Consent for publication: All authors gave consent for the publication. Competing interest: The authors declare no competing interests.
Figures


References
-
- Sweeting A, Hannah W, Backman H, Catalano P, Feghali M, Herman WH, et al. Epidemiology and management of gestational diabetes. The Lancet. 2024;404(10448):175–92. - PubMed
-
- Wang H, Li N, Chivese T, Werfalli M, Sun H, Yuen L, et al. Idf diabetes atlas: estimation of global and regional gestational diabetes mellitus prevalence for 2021 by international association of diabetes in pregnancy study group’s criteria. Diabetes Res Clin Pract. 2022;183: 109050. - PubMed
-
- Saeedi M, Cao Y, Fadl H, Gustafson H, Simmons D. Increasing prevalence of gestational diabetes mellitus when implementing the iadpsg criteria: a systematic review and meta-analysis. Diabetes Res Clin Pract. 2021;172: 108642. - PubMed
MeSH terms
Grants and funding
LinkOut - more resources
Full Text Sources
Medical

