

Construction and evaluation of machine learning-based prediction model for live birth following fresh embryo transfer in IVF/ICSI patients with polycystic ovary syndrome
- PMID: 40186314
- PMCID: PMC11969817
- DOI: 10.1186/s13048-025-01654-x
Construction and evaluation of machine learning-based prediction model for live birth following fresh embryo transfer in IVF/ICSI patients with polycystic ovary syndrome
Abstract
Objective: To investigate the determinants affecting live birth outcomes in fresh embryo transfer among polycystic ovary syndrome (PCOS) patients using various machine learning (ML) algorithms and to construct predictive models, offering novel insights for enhancing live birth rates in this specific group.
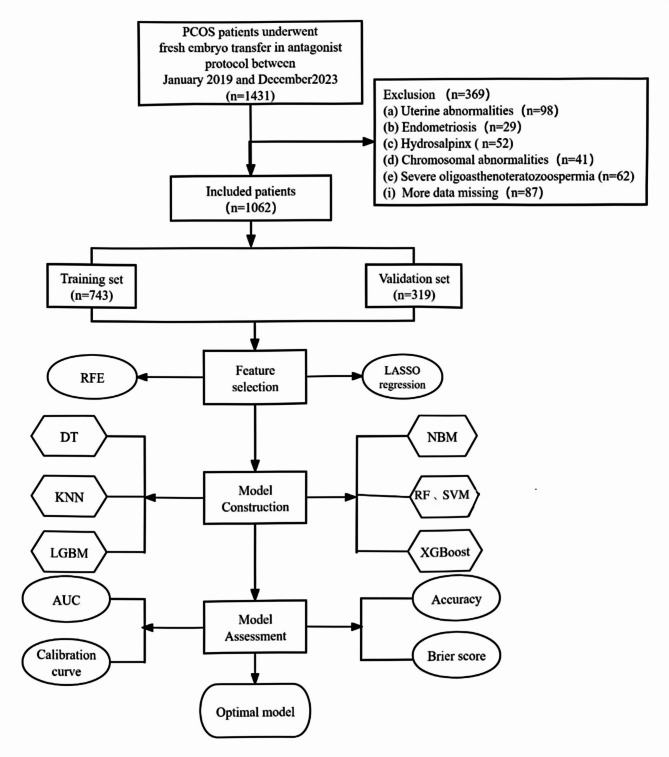
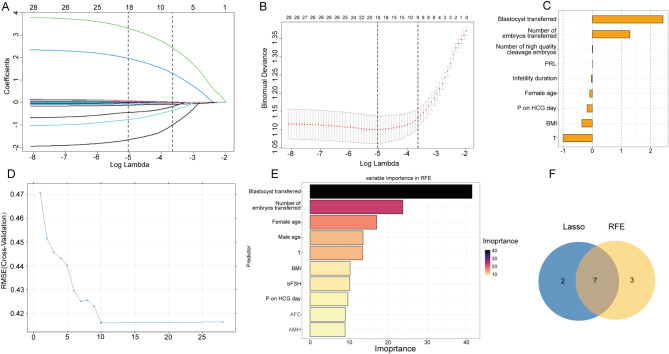
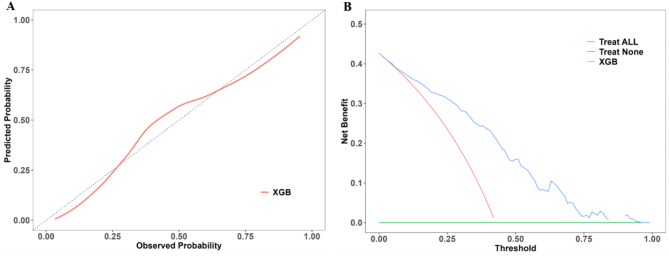
Methods: A sum of 1,062 fresh embryo transfer cycles involving PCOS patients were analyzed, with 466 resulting in live births. The dataset was split randomly into training and testing subsets at a 7:3 ratio. Least absolute shrinkage and selection operator and recursive feature elimination methods were utilized for feature selection within the training data. A grid search strategy identified the optimal parameters for seven ML models: decision tree (DT), K-nearest neighbors (KNN), light gradient boosting machine (LightGBM), naive Bayes model(NBM), random forest (RF), support vector machine (SVM) and extreme gradient boosting (XGBoost). The evaluation of model effectiveness incorporated diverse metrics, encompassing area under the curve (AUC), accuracy, positive predictive value, negative predictive value, F1 score, and Brier score. Calibration curves and decision curve analysis were employed to ascertain the optimal model. Furthermore, Shapley additive explanations were applied to elucidate the importance of predictor variables in the top-performing model.
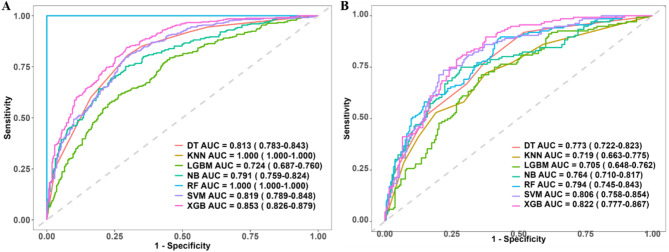
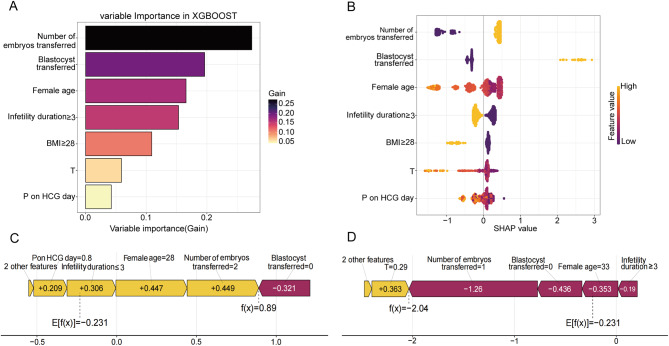
Results: The AUC values of DT, KNN, LightGBM, NBM, RF, SVM and XGBoost models in the training set were 0.813, 1.000, 0.724, 0.791, 1.000, 0.819 and 0.853, respectively. Corresponding values in the testing set were 0.773, 0.719, 0.705, 0.764, 0.794, 0.806 and 0.822. XGBoost emerged as the most effective ML model. SHAP analysis revealed that variables encompassing embryo transfer count, embryo type, maternal age, infertility duration, body mass index, serum testosterone (T) levels, and progesterone (P) levels on the day of human chorionic gonadotropin administration were pivotal predictors of live birth outcomes in individuals with PCOS receiving fresh embryo transfer.
Conclusion: This study developed a live birth prediction model tailored for PCOS fresh embryo transfer cycles, leveraging ML algorithms to compare the efficacy of multiple models. The XGBoost model demonstrated superior predictive capacity, enabling prompt and precise identification of critical risk factors influencing live birth outcomes in PCOS patients. These findings offer actionable insights for clinical intervention, guiding strategies to improve pregnancy outcomes in this population.
Clinical trial number: Not applicable.
Keywords: Fresh embryo transfer; Live birth; Machine learning; Polycystic ovary syndrome.
© 2025. The Author(s).
Conflict of interest statement
Declarations. Ethics approval and consent to participate: This study was performed in accordance with the Declaration of Helsinki and was approved by the Medical Research Ethics Committee of Fujian Maternity and Child Health Hospital (Ethics approval number:2024KY055). Informed patient consent was not required as the study was retrospective in nature and analyzed patient data anonymously. The requirement for informed consent was waived by the Medical Research Ethics Committee of Fujian Maternity and Child Health Hospital. Consent for publication: Not applicable. Competing interests: The authors declare no competing interests.
Figures
Similar articles
-
Constructing a predictive model for live birth following fresh embryo transfer in antagonist protocol for polycystic ovary syndrome.J Assist Reprod Genet. 2024 Oct;41(10):2709-2719. doi: 10.1007/s10815-024-03232-4. Epub 2024 Aug 21. J Assist Reprod Genet. 2024. PMID: 39168929
-
Enhancing predictive models for egg donation: time to blastocyst hatching and machine learning insights.Reprod Biol Endocrinol. 2024 Sep 11;22(1):116. doi: 10.1186/s12958-024-01285-9. Reprod Biol Endocrinol. 2024. PMID: 39261843 Free PMC article.
-
Live birth rate per fresh embryo transfer and cumulative live birth rate in patients with PCOS under the POSEIDON classification: a retrospective study.Front Endocrinol (Lausanne). 2024 May 28;15:1348771. doi: 10.3389/fendo.2024.1348771. eCollection 2024. Front Endocrinol (Lausanne). 2024. PMID: 38863934 Free PMC article.
-
Fresh versus frozen embryo transfers in assisted reproduction.Cochrane Database Syst Rev. 2021 Feb 4;2(2):CD011184. doi: 10.1002/14651858.CD011184.pub3. Cochrane Database Syst Rev. 2021. PMID: 33539543 Free PMC article.
-
Metformin treatment before and during IVF or ICSI in women with polycystic ovary syndrome.Cochrane Database Syst Rev. 2020 Dec 21;12(12):CD006105. doi: 10.1002/14651858.CD006105.pub4. Cochrane Database Syst Rev. 2020. PMID: 33347618 Free PMC article.
Cited by
-
Enhanced machine learning models for predicting three-year mortality in Non-STEMI patients aged 75 and above.BMC Geriatr. 2025 Jul 2;25(1):458. doi: 10.1186/s12877-025-06128-9. BMC Geriatr. 2025. PMID: 40604602 Free PMC article.
-
Cumulative live births and predictive factors of emergency oocyte cryopreservation: a retrospective cohort study.Reprod Biol Endocrinol. 2025 Jun 2;23(1):84. doi: 10.1186/s12958-025-01423-x. Reprod Biol Endocrinol. 2025. PMID: 40457462 Free PMC article.
References
-
- Palomba S, Falbo A, Daolio J, Battaglia FA, La Sala GB. Pregnancy complications in infertile patients with polycystic ovary syndrome: updated evidence. Minerva Ginecol. 2018;70(6):754–60. 10.23736/S0026-4784.18.04230-2. - PubMed
-
- Foroozanfard F, Asemi Z, Bazarganipour F, Taghavi SA, Allan H, Aramesh S. Comparing pregnancy, childbirth, and neonatal outcomes in women with different phenotypes of polycystic ovary syndrome and healthy women: a prospective cohort study. Gynecol Endocrinol. 2020;36(1):61–5. 10.1080/09513590.2019.1631278. - PubMed
-
- Safiri S, Noori M, Nejadghaderi SA, et al. Prevalence, incidence and years lived with disability due to polycystic ovary syndrome in 204 countries and territories, 1990–2019. Hum Reprod. 2022;37(8):1919–31. 10.1093/humrep/deac091. - PubMed
-
- Pavlovic ZJ, Jiang VS, Hariton E. Current applications of artificial intelligence in assisted reproductive technologies through the perspective of a patient’s journey. Curr Opin Obstet Gynecol. 2024;36(4):211–7. 10.1097/GCO.0000000000000951. - PubMed
MeSH terms
Grants and funding
- 2022GGA035/the Fujian provincial health technology project
- 2023J011221/the Fujian Provincial Natural Science Foundation of China
- 2020J05279/the Fujian Provincial Natural Science Foundation of China
- 2023J011229/the Fujian Provincial Natural Science Foundation of China
- 2024Y9572/the Joint Funds for the innovation of science and Technology, Fujian province
LinkOut - more resources
Full Text Sources
Medical
