. 2025 May;241(5):e70033.
doi: 10.1111/apha.70033.

Glucose absorption by isolated, vascularly perfused rat intestine: A significant paracellular contribution augmented by SGLT1 inhibition

Affiliations

Glucose absorption by isolated, vascularly perfused rat intestine: A significant paracellular contribution augmented by SGLT1 inhibition

Cecilie Bæch-Laursen et al. Acta Physiol (Oxf). 2025 May.

Abstract

Aim: Intestinal glucose transport involves SGLT1 in the apical membrane of enterocytes and GLUT2 in the basolateral membrane. In vivo studies have shown that absorption rates appear to exceed the theoretical capacity of these transporters, suggesting that glucose transport may occur via additional pathways, which could include passive mechanisms. The aim of the study was to investigate glucose absorption in an in vitro model, which has proven useful for endocrine studies.

Methods: We studied both transcellular and paracellular glucose absorption in the isolated vascularly perfused rat small intestine. Glucose absorbed from the lumen was traced with 14C-d-glucose, allowing sensitive and accurate quantification. SGLT1 and GLUT2 activities were blocked with phlorizin and phloretin. 14C-d-mannitol was used as an indicator of paracellular absorption.

Results: Our results indicate that glucose absorption in this model involves two transport mechanisms: transport mediated by SGLT1/GLUT2 and a paracellular transport mechanism. Glucose absorption was reduced by 60% when SGLT1 transport was blocked and by 80% when GLUT2 was blocked. After combined luminal SGLT1 and GLUT2 blockade, ~30% of glucose absorption remained. d-mannitol absorption was greater in the proximal small intestine compared to the distal small intestine. Unexpectedly, mannitol absorption increased markedly when SGLT1 transport was blocked.

Conclusion: In this model, glucose absorption occurs via both active transcellular and passive paracellular transport, particularly in the proximal intestine, which is important for the understanding of, for example, hormone secretion related to glucose absorption. Interference with SGLT1 activity may lead to enhanced paracellular transport, pointing to a role in the regulation of the latter.

Keywords: glucose transporter 2; intestinal‐glucose‐absorption; intestine; paracellular transport; permeability; sodium glucose co‐transporter 1; transcellular transport.


Conflict of interest statement

Authors declare no conflicts of interest.

Figures

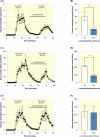
FIGURE 1
FIGURE 1
Glucose absorption by the small intestine. Venous (mmol/L/min) in the venous effluent following luminal infusion of increasing concentrations of glucose (1%–20%) (A). Total glucose absorption is compared to the baseline (luminal saline) by one‐way ANOVA for repeated measurements followed by Bonferroni's multiple comparison test (B). Venous glucose (mmol/L/min) during two luminal glucose (100 mmol/L) stimulation periods separated by a baseline (luminal saline infusion) (C). Total glucose absorption (15‐min stimulation period) is compared by paired t‐test analysis (D) n = 4. Data are shown as mean ± SEM. p < 0.5 is considered significant. *p < 0.05, p < 0.01.
FIGURE 2
FIGURE 2
Luminal phlorizin inhibits intestinal glucose absorption. (A) Glucose absorption traced with 14C‐d‐glucose (μmol/min) during luminal infusion of 10 mmol/L glucose with 1 mmol/L luminal phlorizin, (B) total glucose absorption before and after luminal phlorizin infusion. (C) 100 mmol/L luminal glucose with luminal phlorizin, (D) total glucose absorption before and after luminal phlorizin infusion. (E) 100 mmol/L luminal glucose with 1 mmol/L intra‐arterial phlorizin. (F) Total glucose absorption during 15‐min periods with or without phlorizin. Total glucose absorption with or without phlorizin infusion was compared by paired t‐test analysis. Data are shown as mean ± SEM. p‐values <0.05 was considered significant. *p < 0.05, p < 0.001.
FIGURE 3
FIGURE 3
Vascular infusion of phloretin inhibits glucose absorption. Glucose absorption (μmol/min) traced with 14C‐d‐glucose during (A) 10 mmol/L and intra‐arterial infused phloretin, (B) total glucose absorption in 15‐min period. (C) 100 mmol/L luminal glucose with intra‐arterial phloretin, (D) total glucose absorption in 15‐min periods before and after intra‐arterial phloretin. (E) 100 mmol/L luminal glucose with intra‐luminal phloretin, (F) total glucose absorption before and after luminal phloretin infusion. (G) 100 mmol/L luminal glucose with combined intra‐luminal phlorizin and phloretin infusion. (H) Total 15‐min glucose absorption at baseline and during glucose‐transporter inhibitor infusion. Total glucose absoprtion was compared by paired t‐test. Data are shown as mean ± SEM; n = 4–7. p < 0.05 was considered significant. *p < 0.05, p < 0.01.
FIGURE 4
FIGURE 4
Small intestinal mannitol absorption. Mannitol absorption (μmol/min) traced with 14C‐d‐mannitol during luminal infusions of 100 mmol/L mannitol followed by combined infusion of 100 mmol/L mannitol and 100 mmol/L glucose traced with 14C‐d‐mannitol (A). Total mannitol absorption was compared between the two 15‐min luminal infusions by paired t‐test analysis (B), n = 6. Mannitol absorption (μmol/min) was measured in the proximal (round; bold) and distal (square; bold) small intestine after luminal stimulation of 10 mmol/L mannitol followed by 10 mmol/L glucose, both traced with 14C‐d‐mannitol (C). Total mannitol absorption in each segment was compared between the two 15‐min luminal infusions by paired t‐test analysis (D), n = 5. Data are shown as mean ± SEM. p < 0.05 was considered significant.
FIGURE 5
FIGURE 5
Mannitol absorption during SGLT1 blocking. Mannitol absorption (μmol/min) traced with 14C‐d‐mannitol after luminal infusion of 10 mmol/L mannitol with intra‐luminally infused phlorizin (A–B) or intra‐luminal canagliflozin (60 μmol/L) (C–D). Total mannitol absorption during baseline infusion and during glucose‐transporter inhibitor infusion was compared by paired t test. n = 5. Data are presented as mean ± SEM. p < 0.05 was considered significant. *p < 0.05, p < 0.001.

References

    1. Johansson MEV, Ambort D, Pelaseyed T, et al. Composition and functional role of the mucus layers in the intestine. Cell Mol Life Sci. 2011;68(22):3635‐3641. doi:10.1007/s00018-011-0822-3 - DOI - PMC - PubMed
    1. Allaire JM, Crowley SM, Law HT, Chang SY, Ko HJ, Vallance BA. The intestinal epithelium: central coordinator of mucosal immunity. Trends Immunol. 2018;39(9):677‐696. doi:10.1016/j.it.2018.04.002 - DOI - PubMed
    1. Alvarado F. The relationship between Na+ and the active transport of arbutin in the small intestine. Biochim Biophys Acta Bioenerg. 1965;109(2):478‐494. doi:10.1016/0926-6585(65)90173-1 - DOI - PubMed
    1. Crane RK, Krane SM. Studies on the mechanism of the intestinal active transport of sugars. Biochim Biophys Acta. 1959;31(2):397‐401. doi:10.1016/0006-3002(59)90013-7 - DOI - PubMed
    1. Stevens BR, Kaunitz JD, Wright EM. Intestinal transport of amino acids and sugars: advances using membrane vesicles. Annu Rev Physiol. 1984;46(4):417‐433. doi:10.1146/annurev.ph.46.030184.002221 - DOI - PubMed

MeSH terms

LinkOut - more resources