Cortical Oscillatory Activity and Motor Control in Pediatric Stroke Patients With Hemidystonia
- PMID: 40186512
- PMCID: PMC11971656
- DOI: 10.1002/hbm.70204
Cortical Oscillatory Activity and Motor Control in Pediatric Stroke Patients With Hemidystonia
Abstract
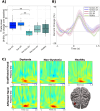
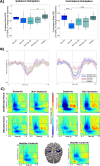
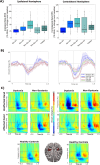
Dystonia is a movement disorder characterized by repetitive muscle contractions, twisting movements, and abnormal posture, affecting 20% of pediatric arterial ischemic stroke (AIS) survivors. Recent studies have reported that children with dystonia are at higher risk of cognitive deficits. The connection between impaired motor outcomes and cognitive impairment in dystonia is not fully understood; dystonia might affect motor control alone, or it could also contribute to cognitive impairment through disruptions in higher-order motor processes. To assess the functional correlates underlying motor control in children with dystonia, we used magnetoencephalography (MEG) to measure frontal theta (4-8 Hz), motor beta (15-30 Hz), and sensorimotor gamma (60-90 Hz) activity during a "go"/"no-go" task. Beamformer-based source analysis was carried out on 19 post-stroke patients: nine with dystonia (mean age = 13.78, SD = 2.82, 8 females), 10 without dystonia (mean age = 12.90, SD = 3.54, 4 females), and 17 healthy controls (mean age = 12.82, SD = 2.72, 8 females). To evaluate inhibitory control, frontal theta activity was analyzed during correct "no-go" (successful withhold) trials. To assess motor execution and sensorimotor integration, movement time-locked beta and sensorimotor gamma activity were analyzed during correct "go" trials. Additionally, the Delis-Kaplan Executive Function System (DKEFS) color-word interference task was used as a non-motor, inhibitory control task to evaluate general cognitive inhibition abilities. During affected hand use, dystonia patients had higher "no-go" error rates (failed withhold) compared to all other groups. Dystonia patients also exhibited higher frontal theta power during correct withhold responses for both affected and unaffected hands compared to healthy controls. Furthermore, dystonia patients exhibited decreased movement-evoked gamma power and gamma peak frequency compared to non-dystonia patients and healthy controls. Movement-related beta desynchronization (ERD) activity was increased in non-dystonia patients for both hands compared to healthy participants. These results confirm that post-stroke dystonia is associated with impaired frontally mediated inhibitory control, as reflected by increased frontal theta power. Post-stroke dystonia patients also exhibited reduced motor gamma activity during movement, reflecting altered sensorimotor integration. The increased beta ERD activity in non-dystonia patients may suggest compensatory sensorimotor plasticity not observed in dystonia patients. These findings suggest that differences in motor outcomes in childhood stroke result from a combination of cognitive and motor deficits.
Keywords: MEG; MRI; dystonia; executive function; inhibitory control; pediatric stroke; “go”/“no‐go”.
© 2025 The Author(s). Human Brain Mapping published by Wiley Periodicals LLC.
Conflict of interest statement
The authors declare no conflicts of interest.
Figures


Similar articles
-
Complementary roles of cortical oscillations in automatic and controlled processing during rapid serial tasks.Neuroimage. 2015 Sep;118:268-81. doi: 10.1016/j.neuroimage.2015.05.081. Epub 2015 Jun 3. Neuroimage. 2015. PMID: 26049145
-
Prefrontal theta modulates sensorimotor gamma networks during the reorienting of attention.Hum Brain Mapp. 2020 Feb 1;41(2):520-529. doi: 10.1002/hbm.24819. Epub 2019 Oct 17. Hum Brain Mapp. 2020. PMID: 31621977 Free PMC article.
-
Movement-induced uncoupling of primary sensory and motor areas in focal task-specific hand dystonia.Neuroscience. 2013 Oct 10;250:434-45. doi: 10.1016/j.neuroscience.2013.07.027. Epub 2013 Jul 20. Neuroscience. 2013. PMID: 23876327
-
Integrated technology for evaluation of brain function and neural plasticity.Phys Med Rehabil Clin N Am. 2004 Feb;15(1):263-306. doi: 10.1016/s1047-9651(03)00124-4. Phys Med Rehabil Clin N Am. 2004. PMID: 15029909 Review.
-
Abnormal reorganization in focal hand dystonia--sensory and motor training programs to retrain cortical function.NeuroRehabilitation. 2008;23(1):43-53. NeuroRehabilitation. 2008. PMID: 18356588 Review.
References
-
- Baron, I. S. 2004. “Delis‐Kaplan Executive Function System.” Child Neuropsychology 10, no. 2: 147–152. 10.1080/09297040490911140. - DOI
MeSH terms
Grants and funding
LinkOut - more resources
Full Text Sources
Medical

