. 2025 Apr 1;46(5):e70208.
doi: 10.1002/hbm.70208.

Effective Motor Skill Learning Induces Inverted-U Load-Dependent Activation in Contralateral Pre-Motor and Supplementary Motor Area

Affiliations

Effective Motor Skill Learning Induces Inverted-U Load-Dependent Activation in Contralateral Pre-Motor and Supplementary Motor Area

Xiaolu Wang et al. Hum Brain Mapp. .

Abstract

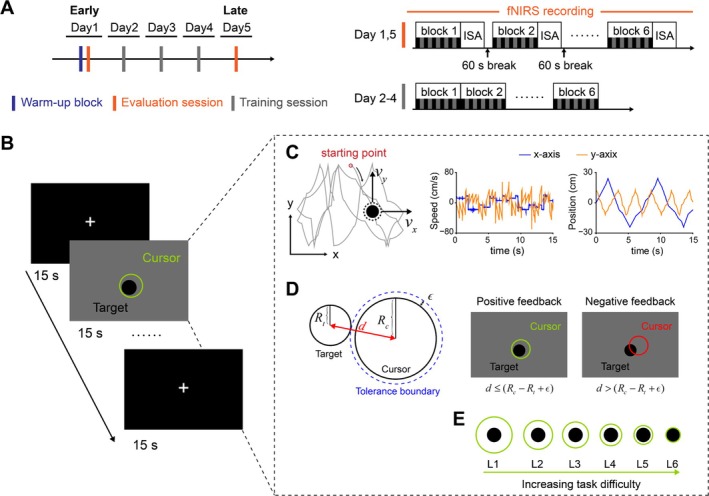
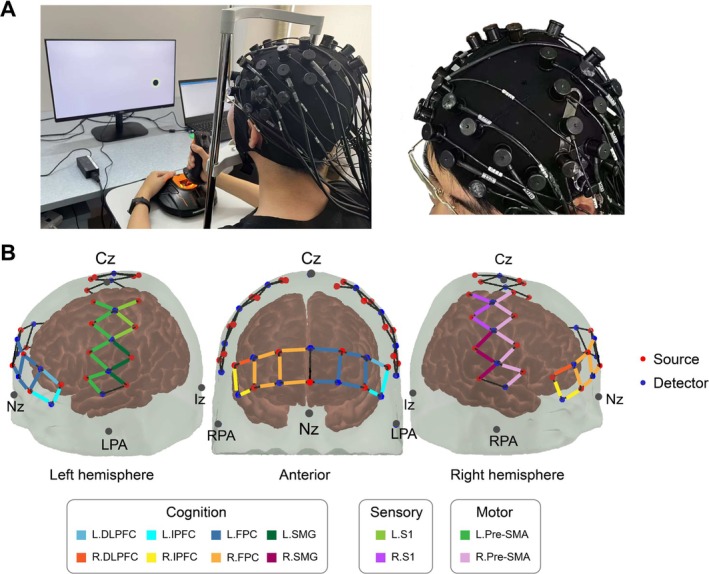
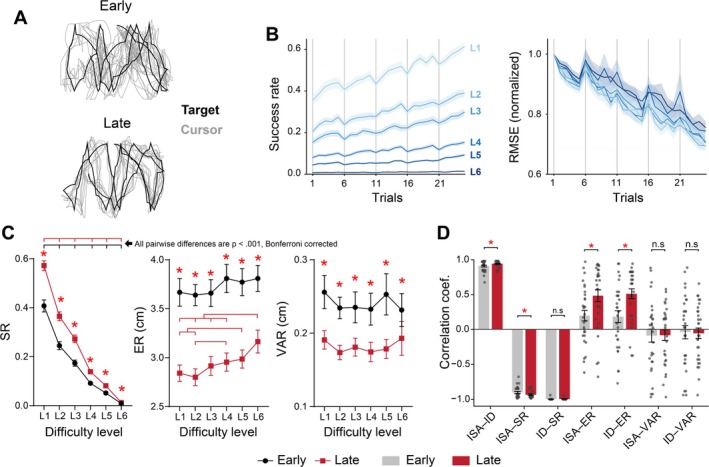
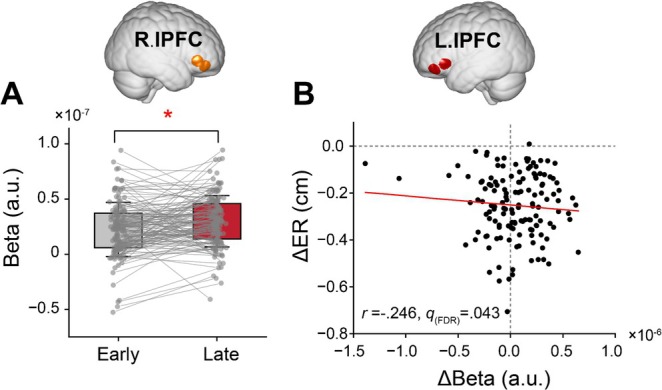
Motor learning involves complex interactions between the cognitive and sensorimotor systems, which are susceptible to different levels of task load. While the mechanism underlying load-dependent regulations in cognitive functions has been extensively investigated, their influence on downstream execution in motor skill learning remains less understood. The current study extends the understanding of whether and how learning alters the load-dependent activation pattern by a longitudinal functional near-infrared spectroscopy (fNIRS) study in which 30 healthy participants (15 females) engaged in extensive practice on a two-dimensional continuous hand tracking task with varying task difficulty. We proposed the index of difficulty (ID) as a quantitative measure of task difficulty, which was monotonically associated with a psychometric measure of subjective workload. As learning progressed, participants exhibited enhanced behavioral and metacognitive performance. Behavioral improvements were accompanied by plastic changes in the inferior prefrontal cortex, reflecting a shift in control strategy during motor learning. Most importantly, we found robust evidence of the learning-induced alteration in load-dependent cortical activation patterns, indicating that effective motor skill learning may lead to the emergence of an inverted-U relationship between cortical activation and load level in the contralateral pre-motor and supplementary motor areas. Our findings provide new insights into the learning-induced plasticity in brain and behavior, highlighting the load-dependent contributions in motor skill learning.

Keywords: continuous movements; motor learning; neural plasticity; task difficulty; workload.


Conflict of interest statement

The authors declare no conflicts of interest.

Figures

FIGURE 1
FIGURE 1
Experimental design. (A) Experimental procedure. Participants visited the laboratory for 5 consecutive days and completed 2 evaluation sessions and 3 training sessions. During the evaluation sessions, fNIRS signals were recorded during the entire experimental period. (B) Main tasks were presented in block design, with 15 s continuous target tracking task interleaved with 15 s fixation period. During the tasks, participants used a joystick to control a circle (the cursor) and tracked the movements of a black disc (the target). (C) A representative target trajectory within a single trial, along with its corresponding speed and position in the horizontal (x‐axis) and vertical (y‐axis) directions. (D) Performance feedback was provided by changing the cursor's color: It turned green (positive feedback) when the target was within the cursor's boundary; otherwise, it turned red (negative feedback). (E) Relative sizes of the target and cursor for each difficulty level. With the target size fixed, deceased cursor size led to increased tasks difficulty. ISA, instantaneous self‐assessment.
FIGURE 2
FIGURE 2
A fNIRS montage. (A) An overview of the experimental setup and fNIRS optode placement. (B) A total of 47 channels (colored squares) were created by 23 sources (red dots) and 15 detectors (blue dots). 12 ROIs were selected based on Talairach Daemon labeled Brodmann areas, which are categorized according to brain functions of cognition, sensory, and motor. See detailed information of fNIRS channels in Table S1 and Figure S2. DLPFC, dorsolateral prefrontal cortex; FPC, frontopolar cortex; IPFC, inferior prefrontal cortex; L, left; Pre‐SMA, pre‐motor and supplementary motor area; R, right; S1, primary somatosensory cortex; SMG, supramarginal gyrus.
FIGURE 3
FIGURE 3
Behavioral results. (A) Representative target and cursor trajectories for a single participant in the early and late stages at the highest difficulty level (L6). (B) Trial‐to‐trial changes in success rate and tracking error (i.e., RMSE). Tracking error is normalized to the baseline (the first trial) for each difficulty level. Vertical lines indicate the beginning of each session. Shaded areas represent SEM across participants. (C) The effects of learning stage and difficulty level on three behavioral measures: SR, ER, and VAR. Red asterisks indicate significant difference between early and late stages. Horizontal lines indicate significant difference between different difficulty levels in the early (red) and late (black) stages, respectively. Error bars represent SEM across participants. (D) Correlation analysis results. Gray dots represent Spearman correlation coefficients for individual participant. Error bars represent SEM across participants. Red asterisks indicate statistical significance between early and late stages; n.s. indicates not significant. Data were collapsed across difficult levels. ER, tracking error; ID, index of difficulty; ISA, instantaneous self‐assessment; SR, success rate; VAR, trial‐to‐trial variability.
FIGURE 4
FIGURE 4
Learning‐related changes in the IPFC. (A) Significant increased activation after training was observed in the right IPFC. Red asterisk indicates statistical significance after FDR correction (qFDR<0.05). Error bars indicate SD. (B) A scatter plot illustrating the relationship between changes in Beta and ER (calculated as Late minus Early) in the left IPFC. Correlation was calculated by Partial Pearson correlation coefficient between changes in Beta and ER, controlling baseline activation Beta and ER in the early stage as covariates. (B) Scatter plot illustrating the relationship between Δ Beta and Δ ER. Dots represent individual observation. Red line indicates linear regression. Data were collapsed across difficult levels. ER, tracking error; IPFC, inferior prefrontal cortex; L, left; R, right.
FIGURE 5
FIGURE 5
Individual differences in brain‐behavior relationships. Pearson correlation coefficient was calculated between cortical activation (i.e., beta value) and behavioral measures of (A) ER, (B) VAR, and (C) SR in the early and late stages. Red asterisks indicate statistical significance (qFDR<0.05). Data were collapsed across difficult levels (see results at each difficulty level in Figure S5). DLPFC, dorsolateral prefrontal cortex; ER, tracking error; FPC, frontopolar cortex; IPFC, inferior prefrontal cortex; L, left; Pre‐SMA, pre‐motor and supplementary motor area; R, right; S1, primary somatosensory cortex; SMG, supramarginal gyrus; SR, success rate; VAR, trial‐to‐trial variability.
FIGURE 6
FIGURE 6
Load‐dependent cortical activation pattern in different learning stages. LMM was used to test the Within‐subject effects of (A) objective task difficulty (i.e., ID) and (B) subjective workload (i.e., ISA) on cortical activation (i.e., beta value) in the early and late stages. ΔAIC>0 favors the quadratic model. Red asterisks indicate qFDR<0.05, suggesting that the quadratic model significantly improves the goodness‐of‐fit. Relationship between group level cortical activation and task load in the early and late stage, illustrated by Beta as function of (C) ID and (D) ISA in L.Pre‐SMA. Solid lines represent the best fit using either the linear model (early stage) or the quadratic (late stage) model. Error bars indicate SEM across participants. DLPFC, dorsolateral prefrontal cortex; FPC, frontopolar cortex; ID, index of difficulty; IPFC, inferior prefrontal cortex; ISA, instantaneous self‐assessment; L, left; Pre‐SMA, pre‐motor and supplementary motor area; R, right; S1, primary somatosensory cortex; SMG, supramarginal gyrus.

Similar articles

References

    1. Akizuki, K. , and Ohashi Y.. 2015. “Measurement of Functional Task Difficulty During Motor Learning: What Level of Difficulty Corresponds to the Optimal Challenge Point?” Human Movement Science 43: 107–117. 10.1016/j.humov.2015.07.007. - DOI - PubMed
    1. Anguera, J. A. , Reuter‐Lorenz P. A., Willingham D. T., and Seidler R. D.. 2010. “Contributions of Spatial Working Memory to Visuomotor Learning.” Journal of Cognitive Neuroscience 22, no. 9: 1917–1930. - PubMed
    1. Aron, A. R. , Robbins T. W., and Poldrack R. A.. 2014. “Inhibition and the Right Inferior Frontal Cortex: One Decade on.” Trends in Cognitive Sciences 18, no. 4: 177–185. - PubMed
    1. Baker, W. B. , Parthasarathy A. B., Busch D. R., Mesquita R. C., Greenberg J. H., and Yodh A. G.. 2014. “Modified Beer–Lambert Law for Blood Flow.” Biomedical Optics Express 5, no. 11: 4053–4075. 10.1364/BOE.5.004053. - DOI - PMC - PubMed
    1. Benjamini, Y. , and Hochberg Y.. 1995. “Controlling the False Discovery Rate: A Practical and Powerful Approach to Multiple Testing.” Journal of the Royal Statistical Society Series B (Statistical Methodology) 57, no. 1: 289–300.