. 2025 Apr 5;41(1):66.
doi: 10.1007/s10565-025-10011-z.

Lamin A/C regulates cerebellar granule cell maturation

Affiliations

Lamin A/C regulates cerebellar granule cell maturation

Laura Vilardo et al. Cell Biol Toxicol. .

Abstract

Lamin A/C is a nuclear type V intermediate filament protein part of the meshwork structure underlying the inner nuclear membrane (nuclear lamina), which plays numerous roles, including maintenance of nuclear shape, heterochromatin organization, and transcriptional regulation. Our group has demonstrated the role of Lamin A/C in different pathophysiological conditions. Here, we investigated for the first time how Lamin A/C affects neuronal maturation in rat cerebellar granule cells (GCs). Primary rat cerebellar GCs where we silenced the Lmna gene constituted our key model; this provided a rather homogeneous cellular system showing a neuronal population in vitro. We then validated our findings in another in vivo murine model with knock-out of the Lmna gene and in an in vitro human neuronal model with silencing of the LMNA gene. We observed across three different models that Lamin A/C down-regulation affects neurons maturation by protecting the cells from glutamate-evoked excitotoxicity and correlates with an inhibition of calcium influxes and a down-regulation of pro-inflammatory cytokine pathways. Consistent with previous findings from our group, this study corroborates that Lamin A/C plays a key role in neural development and opens new significant implications for a better comprehension of the mechanisms involved in neurodegenerative diseases, where changes in the nuclear envelope are linked to neuroinflammatory processes and damage.

Keywords: Lamin A/C; Neuronal development; Cerebellar granule cells; Glutamate; Neurotoxicity.


Conflict of interest statement

Declarations. Competing interests: The authors declare no competing interests.

Figures
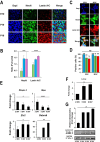
Fig. 1
Fig. 1
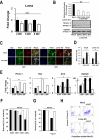
Lamin A/C increases during rat cerebellar GC maturation. A Representative confocal images of rat cerebellar slices of embryonic (E10) and post-natal (P10, P18) days immunostained for Lamin A/C (red), Neuronal Nuclear Antigen (NeuN, green) and nuclei (blue). Scale bar: 40 µm. B Quantification of the fluorescence in E18 (green), P10 (blue sky) and P18 (purple) images in Fig. 1A was performed by ImageJ software and expressed as the ratio between the intensity fluorescence of NeuN or Lamin A/C and the nuclei fluorescence. Three different microscopic fields were considered in each condition. C Representative confocal images of NeuN (green), Lamin A/C (red) and nuclei (Dapi, blue) in GCs at 2 and 8 days in vitro (DIV). Scale bar: 15 microns. D Counts of positive fluorescent cells were performed by ImageJ software in GCs at 2 and 8 DIV. Blue (nuclei), green (NeuN), red (Lamin A/C). Four different microscopic fields were considered in each condition. The number on each histogram represents the percentage of positive cells. E RT-qPCR analysis of the indicated genes in GCs at 2, 5 and 8 DIV. Data are reported as the level of mRNA relative to 2 DIV and are expressed as mean ± standard error (SE; n = 3). F RT-qPCR analysis of Lmna gene expression in GCs at 2, 5 and 8 DIV. Data are reported as the level of mRNA relative to 2 DIV and are expressed as mean ± SE (n = 3). G Representative blots of the Lamin A/C protein expression in GCs at 0, 2, 5 and 8 DIV and relative densitometric analysis. GAPDH was used as protein loading control (n = 3). All the experiments were repeated at least three times with independent results, the number (n) of experiments is shown in each case. One-way ANOVA test: *p ≤ 0.05; **p ≤ 0.01; ***p ≤ 0.001; ****p ≤ 0.0001
Fig. 2
Fig. 2
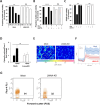
Lmna knock-down decreases glutamate sensitivity in rat GCs. A RT-qPCR analysis of Lmna mRNA levels in Lmna-KD rat GCs (white) relative to a sister control culture (black). Data are expressed as mean ± SE (n = 5). B Representative blots, and relative densitometric analysis, of Lamin A/C protein in control (Mock) and Lmna-KD GCs at 2, 5 and 8 DIV. GAPDH was used to control protein loading (n = 3). C Representative fluorescent images of NeuN (green), Lamin A/C (red) and Dapi (blue), in Mock and Lmna-KD GCs at 2 and 8 DIV. Scale bar:15 microns. D Quantification of the fluorescence in Mock (black) and Lmna-KD (white) GC images in Fig. 2C at 2 DIV and 8 DIV was performed by ImageJ software and expressed as the ratio between the intensity fluorescence of NeuN or Lamin A/C and the nuclei fluorescence. E RT-qPCR analysis of the indicated genes in Lmna-KD rat GCs (white). Data are reported as the fold change of the mRNA expression relative to Mock 2 DIV (black) and are expressed as mean ± SE (n = 5). F Cell viability analysis in Mock (black) and Lmna-KD (white) GCs exposed to a pulse of 100 µM glutamate for 30 min, as evaluated by counting intact nuclei (see Methods for details) at different DIV. Data represent the means ± SD (n = 5) of viable cells calculated as the ratio (%) between intact nuclei counted after the glutamate pulse and those counted in a sister control culture and are expressed as % of control. G Cell viability analysis in Mock (black) and Lmna-KD (white) GCs exposed to a pulse of 100 µM glutamate for 30 min, at 8 DIV as evaluated by CCK8 cell viability assay. Data represent the means ± SD (n = 3) of absorbance as measured by spectrofluorometer and are expressed as % of control. H Representative FACS cytograms showing cell death analysis after glutamate exposure by annexin V assay in Mock and Lmna-KD GCs at 8 DIV (n = 3). In the cytograms are reported the percentage of cells in each quadrant (Q). Q1 = PI positive non-viable cells that underwent necrosis; Q2 = PI + Annexin V positive late apoptotic cells; Q3 = Annexin positive early apoptotic cells; Q4 = negative viable cells. All the experiments were performed at least three times with independent results, the number (n) of experiments is shown in each case. When SD bar is not evident, it is included in the histogram. One-way ANOVA test: *p ≤ 0.05; **p ≤ 0.01; ***p < 0.001; ****p < 0.0001
Fig. 3
Fig. 3
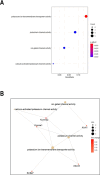
Functional enrichment analysis of up-regulated DEGs in Lmna-KD vs Mock rat GCs. A Bubble plot showing a selection of Gene Ontology Molecular Functions (GO-MF) terms enriched by up-regulated DEGs. Bubble size represents the number of DEGs involved in each function, while colour gradient indicates statistical significance of the enrichment (adjusted p-values). B Network plot of the selected GO-MF terms and corresponding up-regulated DEGs involved in each function. Circle size of the terms represents the number of DEGs involved, while colour gradient indicates fold-change values of DEGs
Fig. 4
Fig. 4
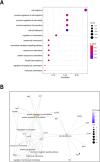
Functional enrichment analysis of down-regulated DEGs in Lmna-KD vs Mock rat GCs. A Bubble plot showing a selection of Gene Ontology Biological Process (GO-BP) terms enriched by down-regulated DEGs. Bubble size represents the number of DEGs involved in each process, while colour gradient indicates statistical significance of the enrichment (adjusted p-values). B Network plot of the selected GO-BP terms and corresponding down-regulated DEGs involved in each process. Circle size of the terms represents the number of DEGs involved, while colour gradient indicates fold-change values of DEGs
Fig. 5
Fig. 5
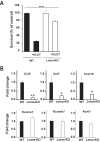
Effect of Lmna-KO on mouse GC glutamate sensitivity and gene expression. A Cell viability analysis in wild-type (WT, black) and Lmna-KO murine GCs (white) exposed to a pulse of 100 µM glutamate for 30 min (see Methods for details) at 8 DIV, as evaluated by counting intact nuclei. Data represent means ± SE (n = 5) of viable cells calculated as the ratio (%) between intact nuclei counted after the glutamate pulse and those counted in a sister control culture. When SE bar is not evident, it is included in the histogram. One-way ANOVA test: ****p < 0.0001. B RT-qPCR validation of rat GC gene expression profiling results. Fold-change values of the mRNA expression levels of Ccl5, Ccl7, Cxcl10, Kcnma1, Kcnmb1 and Kct1 in GCs derived from Lmna-KO (white) and WT (black) mouse brains are reported. Data represent means ± SE across ten independent mice (n = 10: 5 WT and 5 KO mice). Student's t-test: * p < 0.05; **p < 0.01
Fig. 6
Fig. 6
Functional enrichment analysis of DEGs found in LMNA-KD vs Mock SH-SY5Y human neuronal cells. A Bubble plot showing a selection of Gene Ontology Molecular Functions (GO-MF) terms enriched by up-regulated DEGs. B Bubble plot showing a selection of Gene Ontology Biological Process (GO-BP) terms enriched by down-regulated DEGs. Bubble size represents the number of DEGs involved in each term, while colour gradient indicates statistical significance of the enrichment (adjusted p-values)
Fig. 7
Fig. 7
LMNA knock-down reduces intracellular calcium and prevents glutamate-evoked excitotoxicity in SH-SY5Y cells. A Cell viability analysis in Mock (black) and LMNA-KD (white) SH-SY5Y cells exposed at the indicated concentrations (in mM) of glutamate for 24 h, as evaluated by propidium iodide cell viability assay. B Cell viability analysis in Mock (black) and LMNA-KD (white) SH-SY5Y cells exposed at 60 mM of glutamate for 24 h, in presence or not of BAPTA calcium chelator, as evaluated by propidium iodide cell viability assay. C Cell viability analysis in Mock (black) and LMNA-KD (white) SH-SY5Y cells exposed at 60 mM of glutamate for 24 h, in presence or not of BAPTA calcium chelator, as evaluated by CCK8 cell viability assay. D Cytosolic calcium concentration in Mock (black) and Lmna-KD (white) GCs exposed to 100 µM of glutamate for 30 min, as evaluated by Fluo-4 Direct Calcium Assay Kits (Molecular Probes). E Representative confocal microscopic images which show the fluorescence intensity of intracellular calcium content in Mock and LMNA-KD SH-SY5Y cells, as evaluated by the Fluo-4 Direct Calcium Assay Kits (Molecular Probes) after glutamate exposure. F Time course of the change in fluorescence during the glutamate superinfusion in Mock and LMNA-KD SH-SY5Y cells. The dispersion around the graph lines represents the SD of the different measurements. ΔF/Fo = variation of fluorescence intensity divided by the fluorescence intensity at time zero. G Representative FACS cytograms of Fluo-4-FL1 cell-associated fluorescence in Mock and LMNA-KD SH-SY5Y cells, as evaluated by Fluo-4 Direct Calcium Assay Kits (Molecular Probes). The number in the cytogram represents the percentage of Fluo-4 positive cells in both lines after glutamate exposure. All experiments were performed at least three times with independent results. One-way ANOVA test: **p ≤ 0.01; ****p < 0.0001; ns = not significant. Glut, glutamate
Fig. 8
Fig. 8
Graphical summary of the results shown in this paper

References

    1. Agalliu D, Schieren I. Heterogeneity in the developmental potential of motor neuron progenitors revealed by clonal analysis of single cells in vitro. Neural Dev. 2009;4:2. 10.1186/1749-8104-4-2. - PMC - PubMed
    1. Alieh LHA and Herrera A. Heterogeneity and developmental dynamics of mammalian neocortical progenitors. Current Opinion Syst Biol. 2023;32–33:100444. 10.1016/j.coisb.2023.100444.
    1. Amadoro G, Serafino AL, Barbato C, Ciotti MT, Sacco A, Calissano P, Canu N. Role of N-terminal tau domain integrity on the survival of cerebellar granule neurons. Cell Death Differ. 2004;11:217–30. 10.1038/sj.cdd.4401314. - PubMed
    1. Amadoro G, Pieri M, Ciotti MT, Carunchio I, Canu N, Calissano P, Zona C, Severini C. Substance P provides neuroprotection in cerebellar granule cells through Akt and MAPK/Erk activation: evidence for the involvement of the delayed rectifier potassium current. Neuropharmacology. 2007;52(6):1366–77. 10.1016/j.neuropharm.2007.01.020. - PubMed
    1. Ankarcrona M, Dypbukt JM, Bonfoco E, Zhivotovsky B, Orrenius S, Lipton SA, Nicotera P. Glutamate-induced neuronal death: a succession of necrosis or apoptosis depending on mitochondrial function. Neuron. 1995;15(4):961–73. 10.1016/0896-6273(95)90186-8. - PubMed

LinkOut - more resources