. 2025 Apr 22;44(4):115509.
doi: 10.1016/j.celrep.2025.115509. Epub 2025 Apr 4.

The Chlamydia effector Dre1 binds dynactin to reposition host organelles during infection

Affiliations

The Chlamydia effector Dre1 binds dynactin to reposition host organelles during infection

Jessica Sherry et al. Cell Rep. .

Abstract

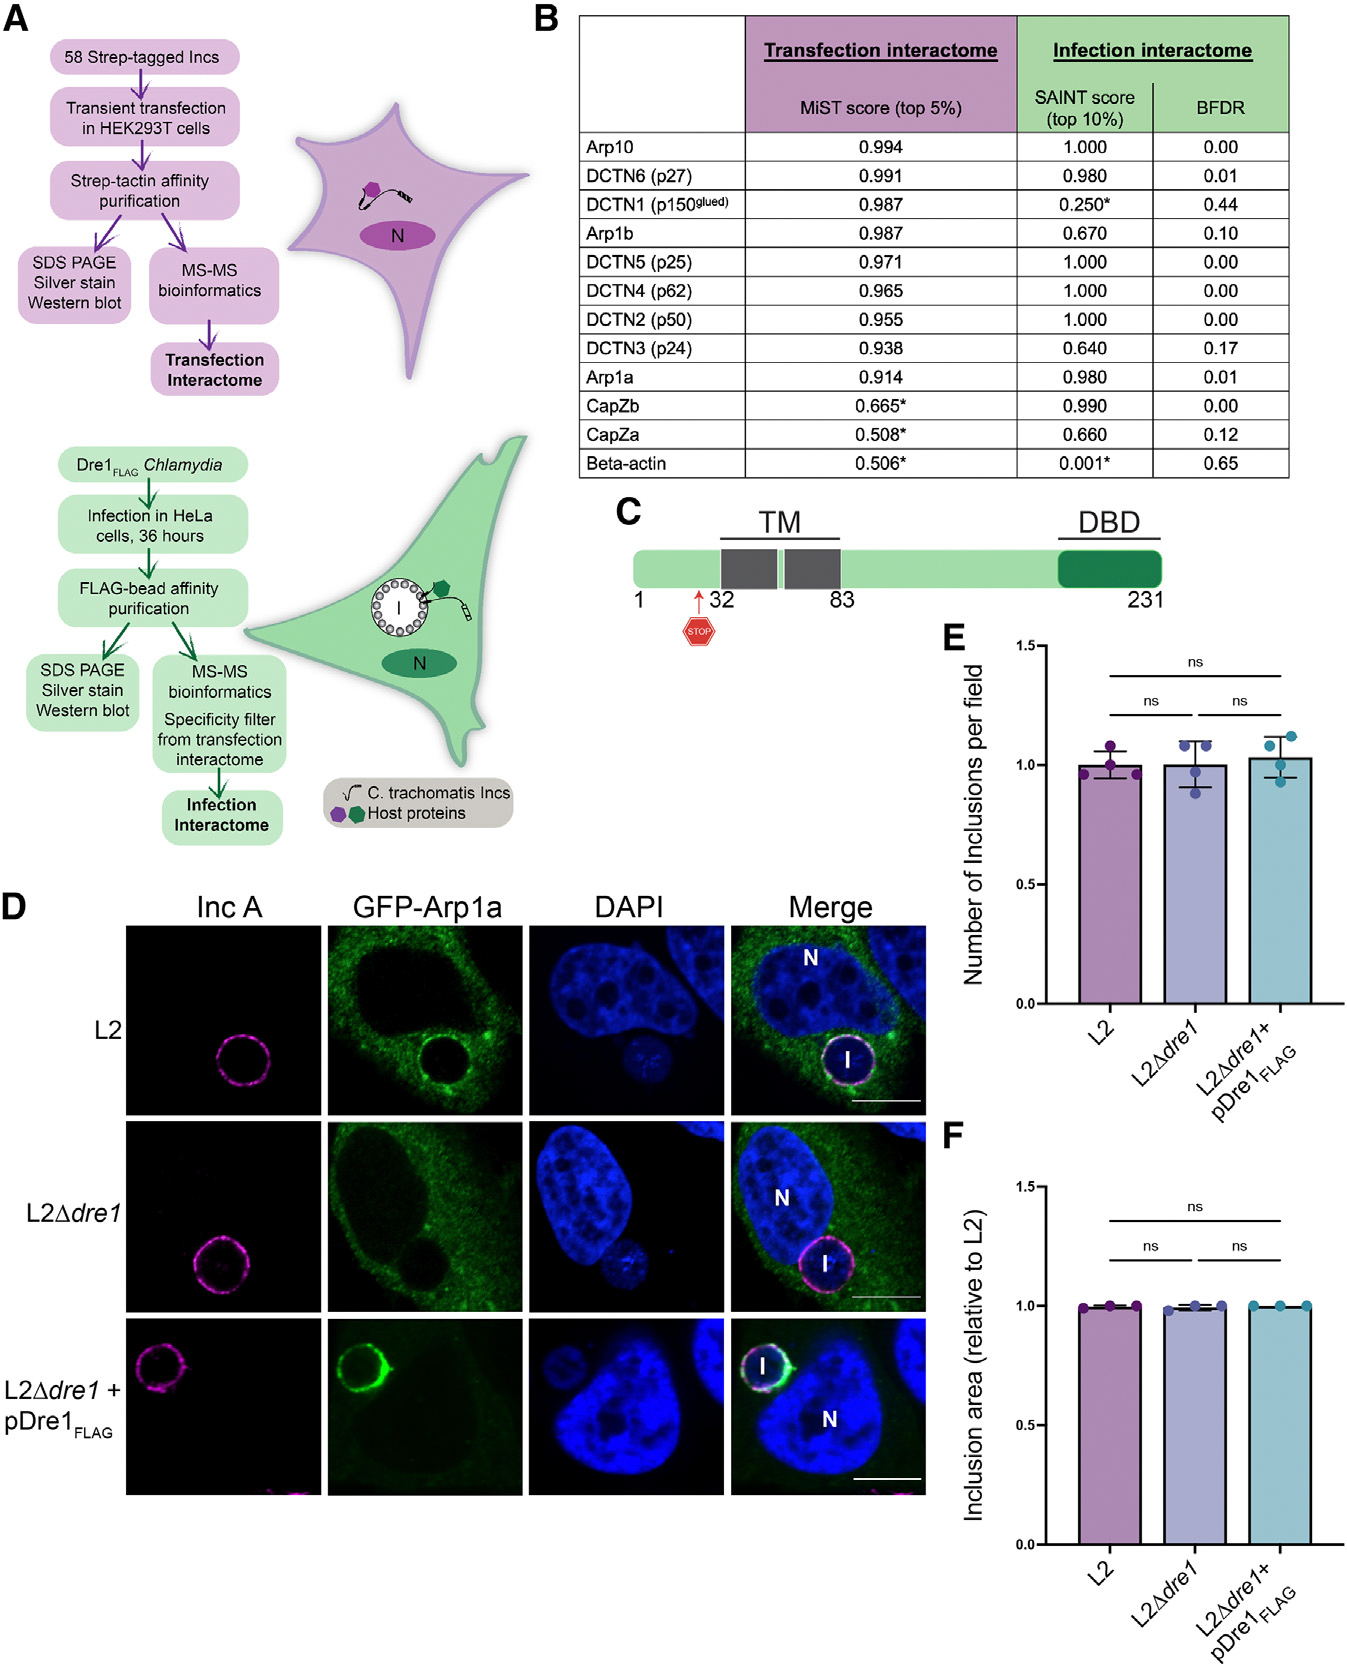
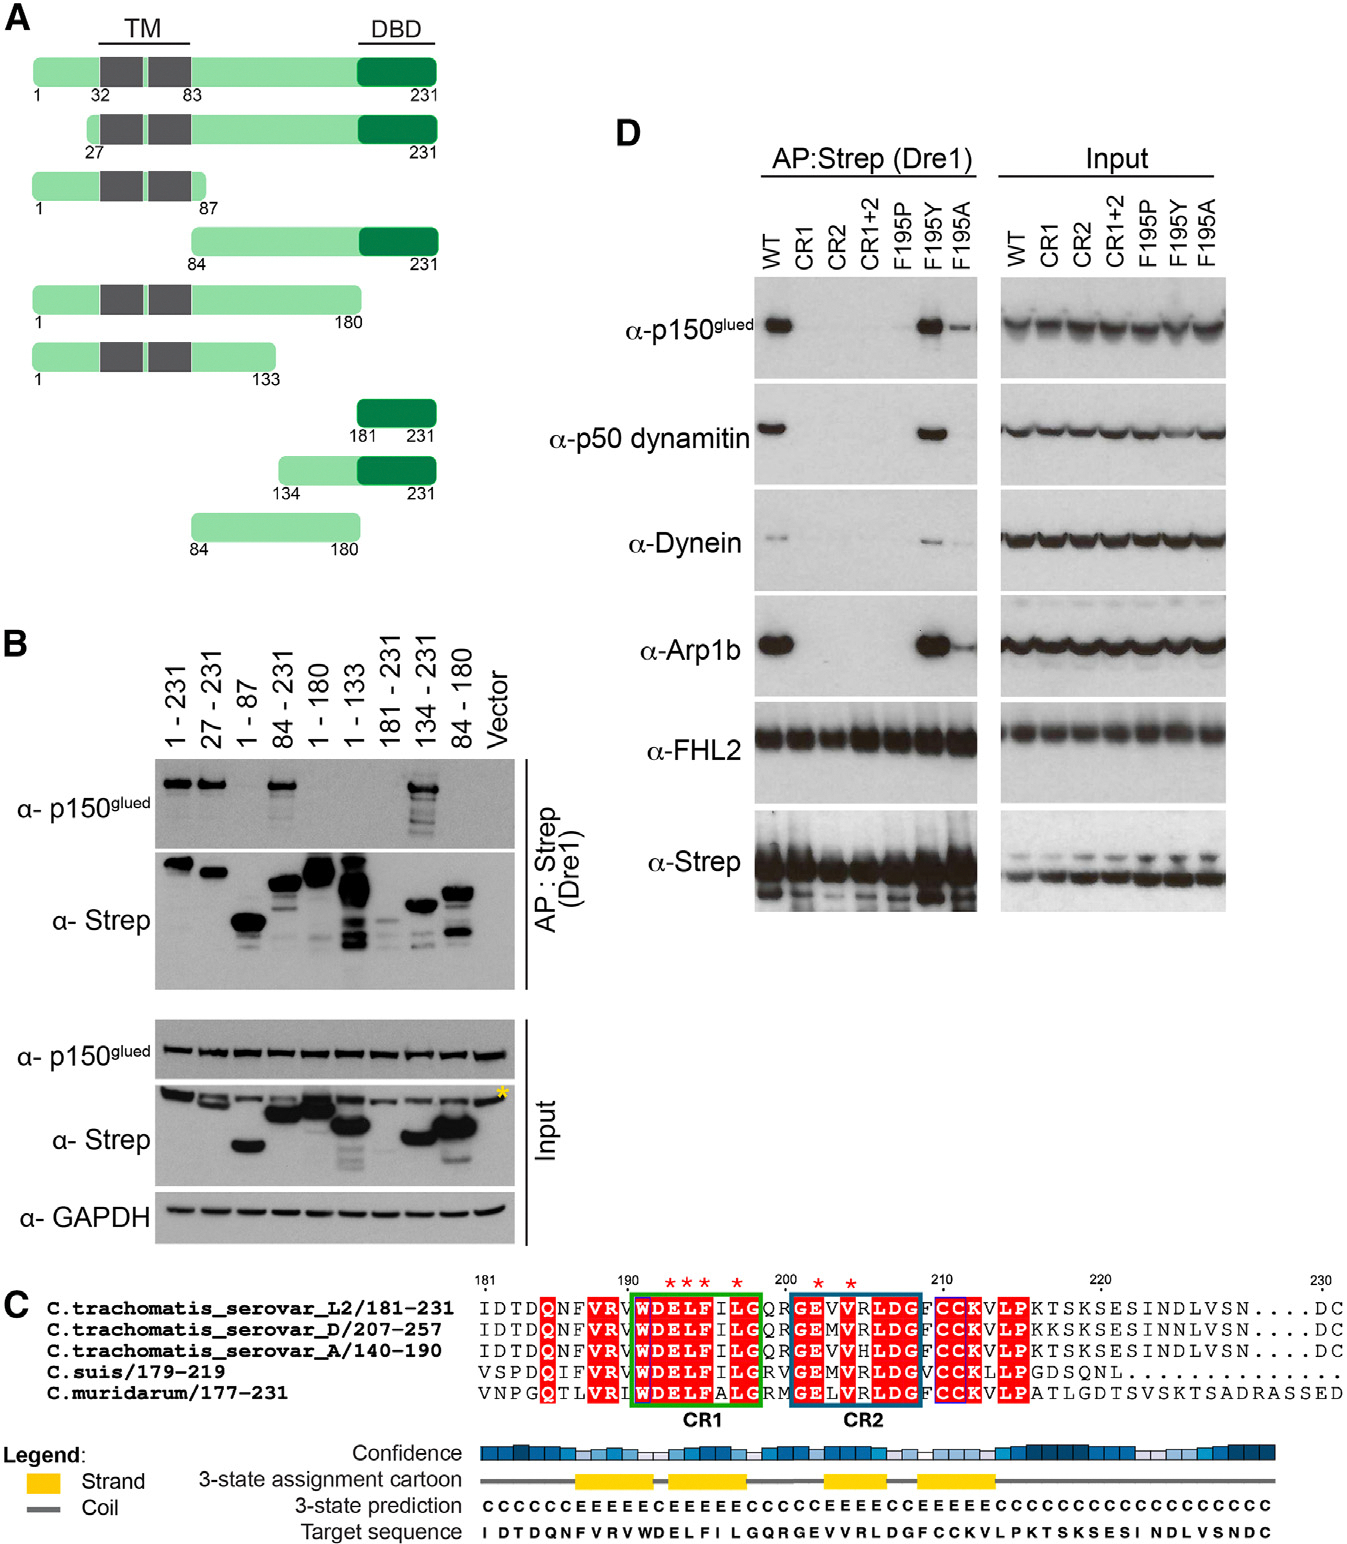
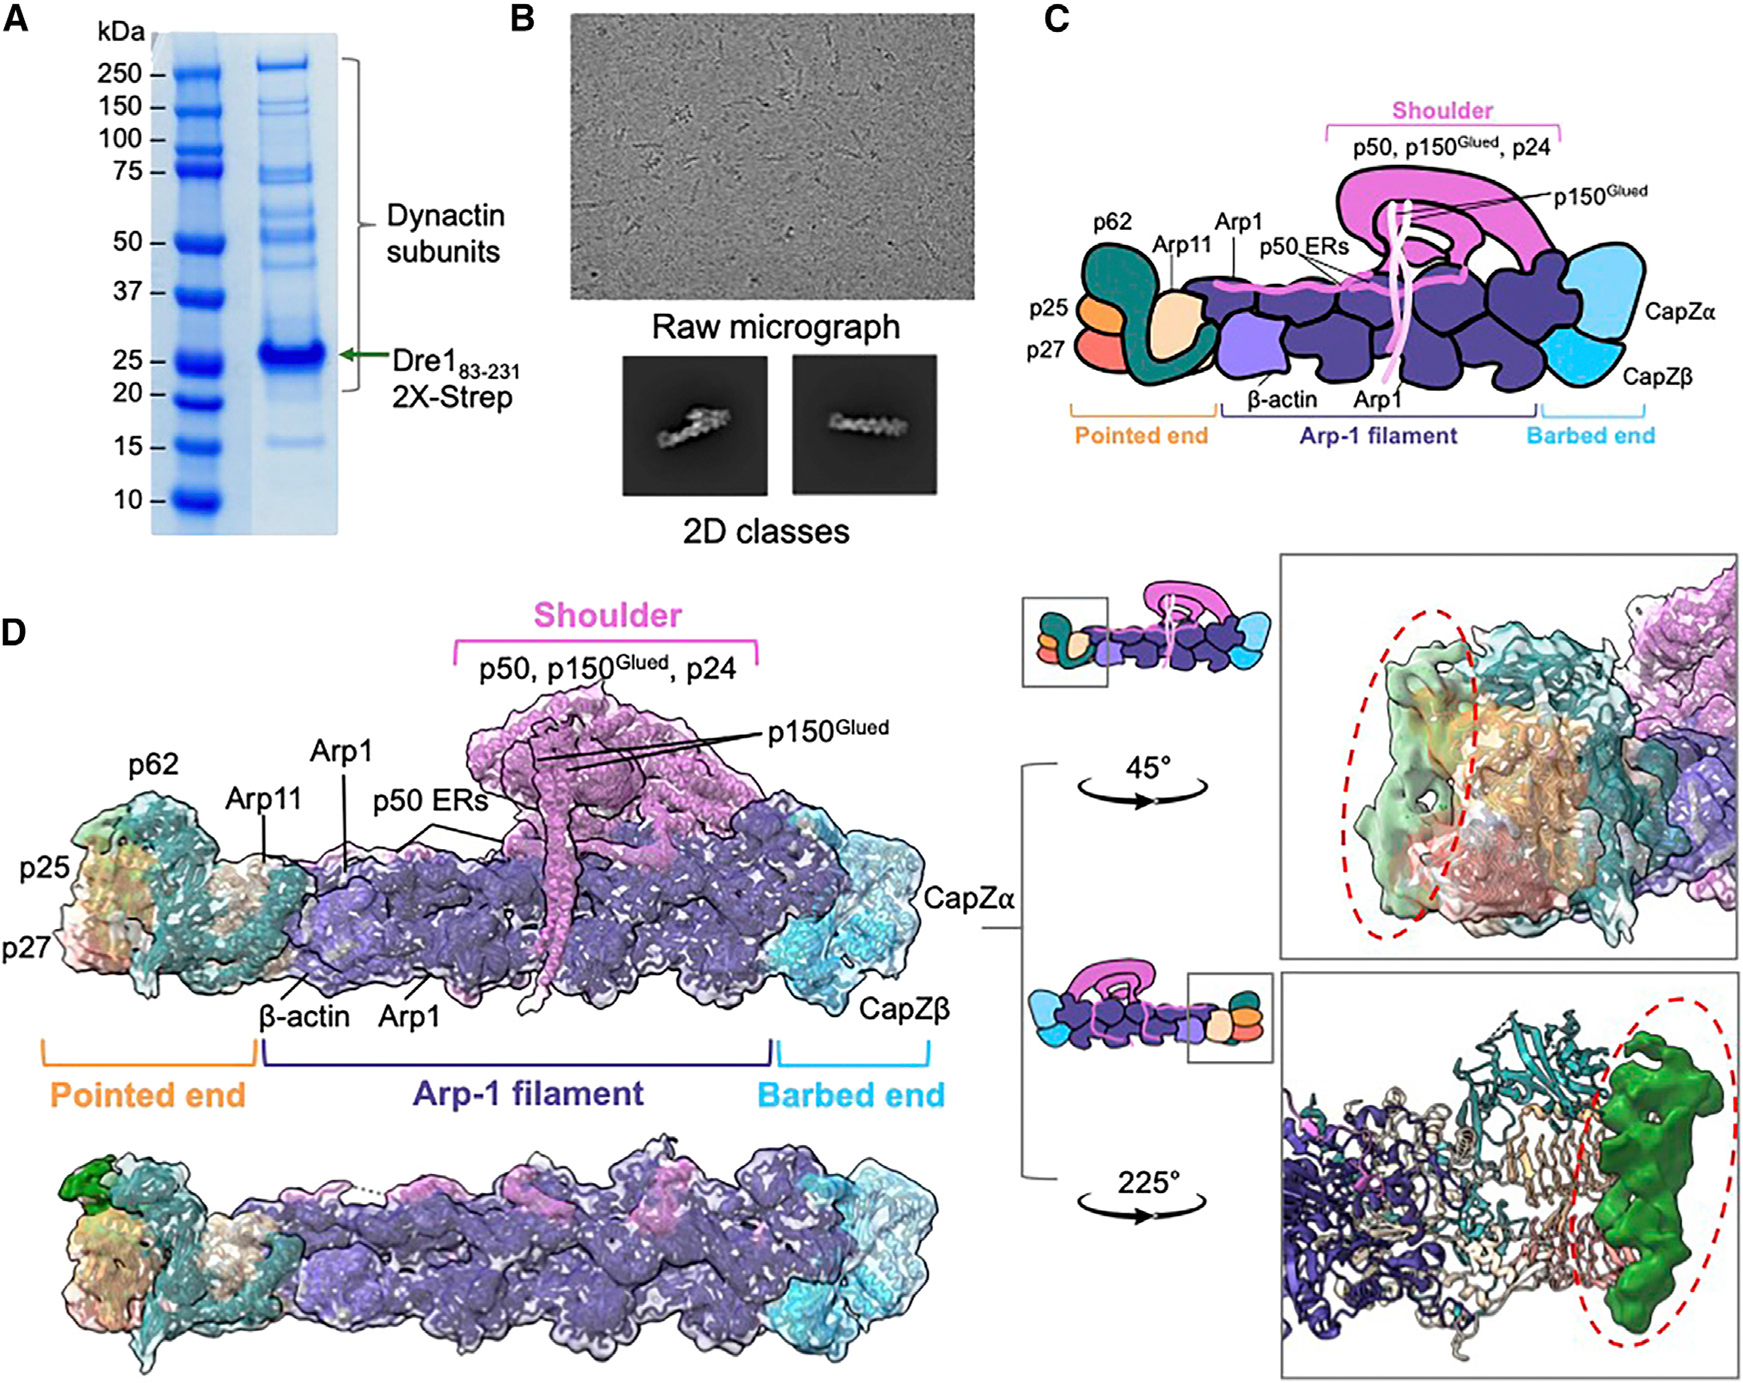
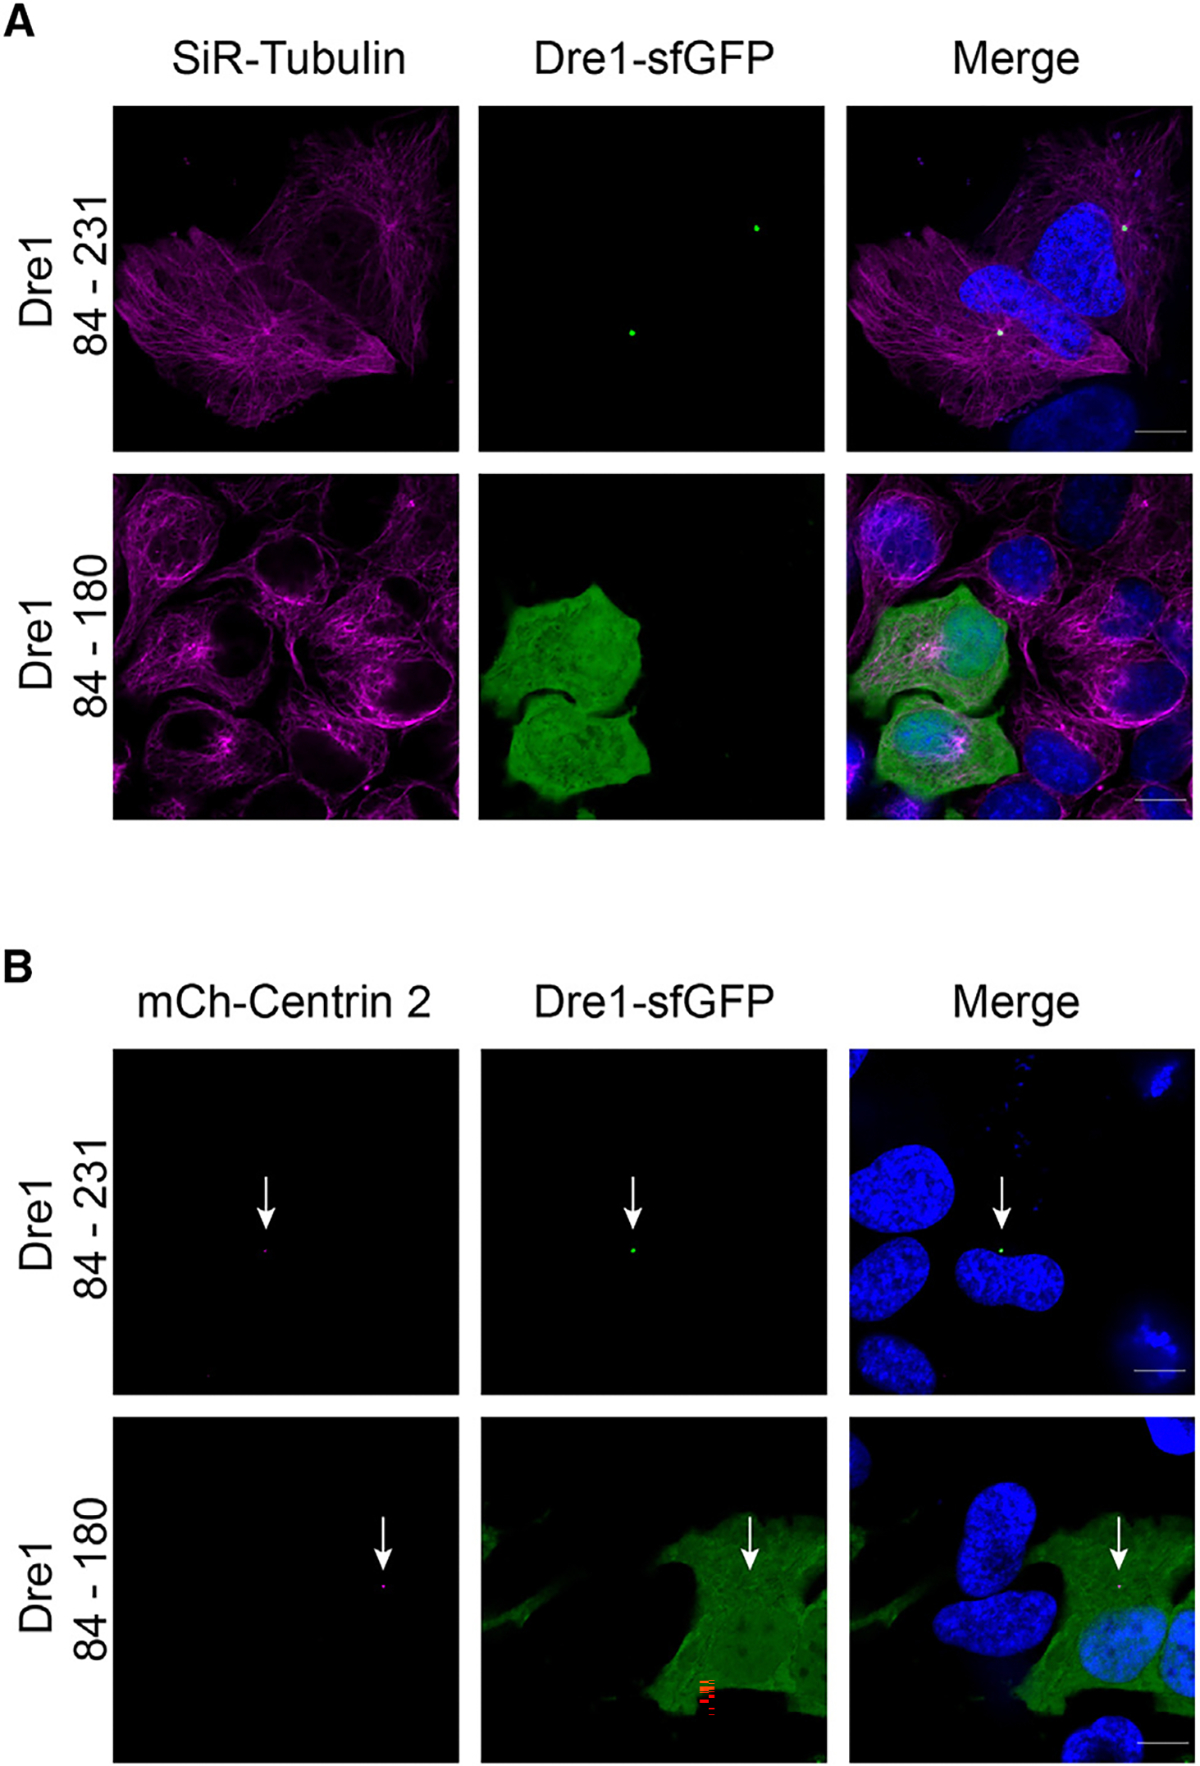
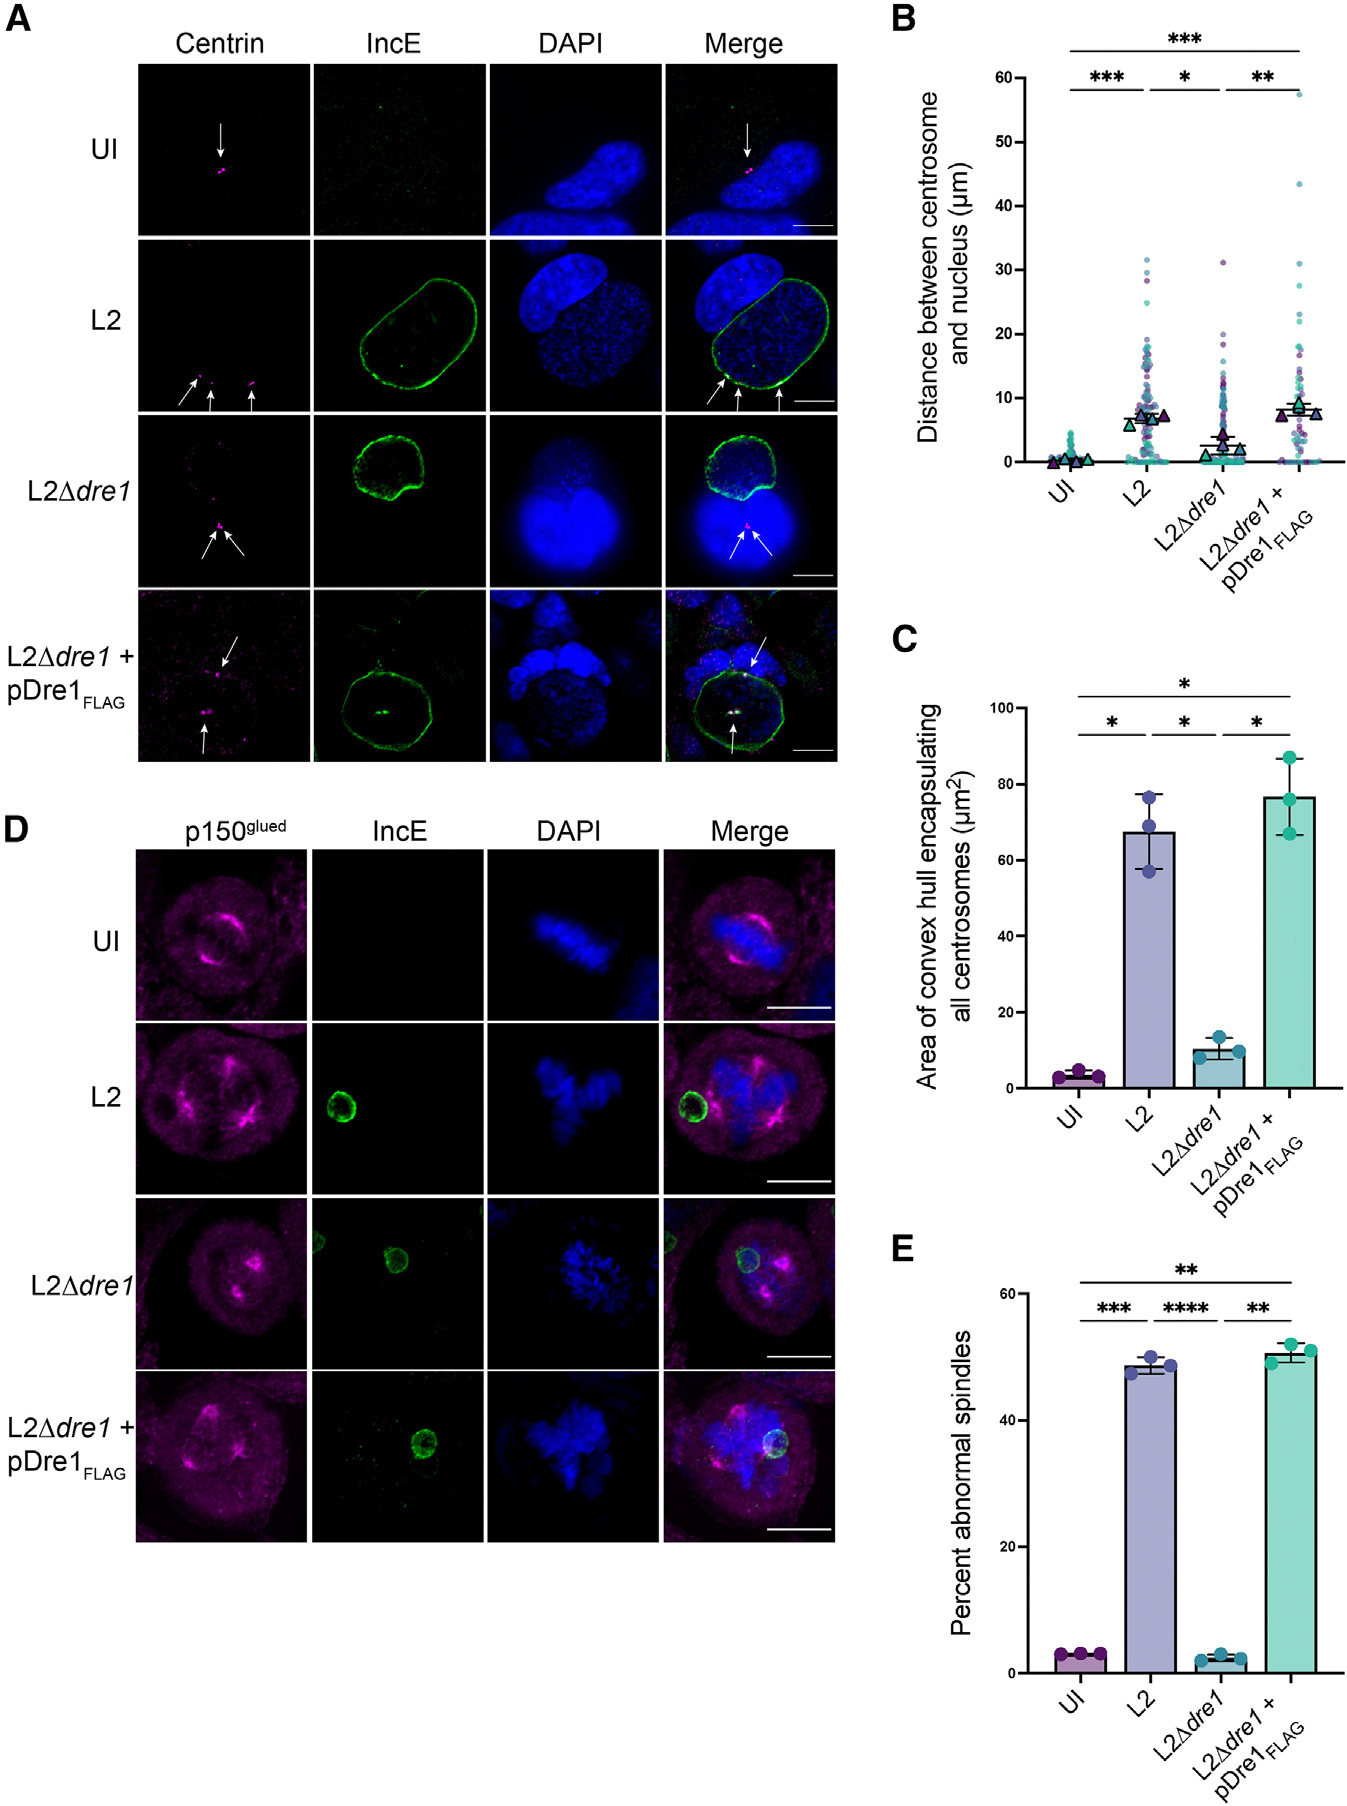
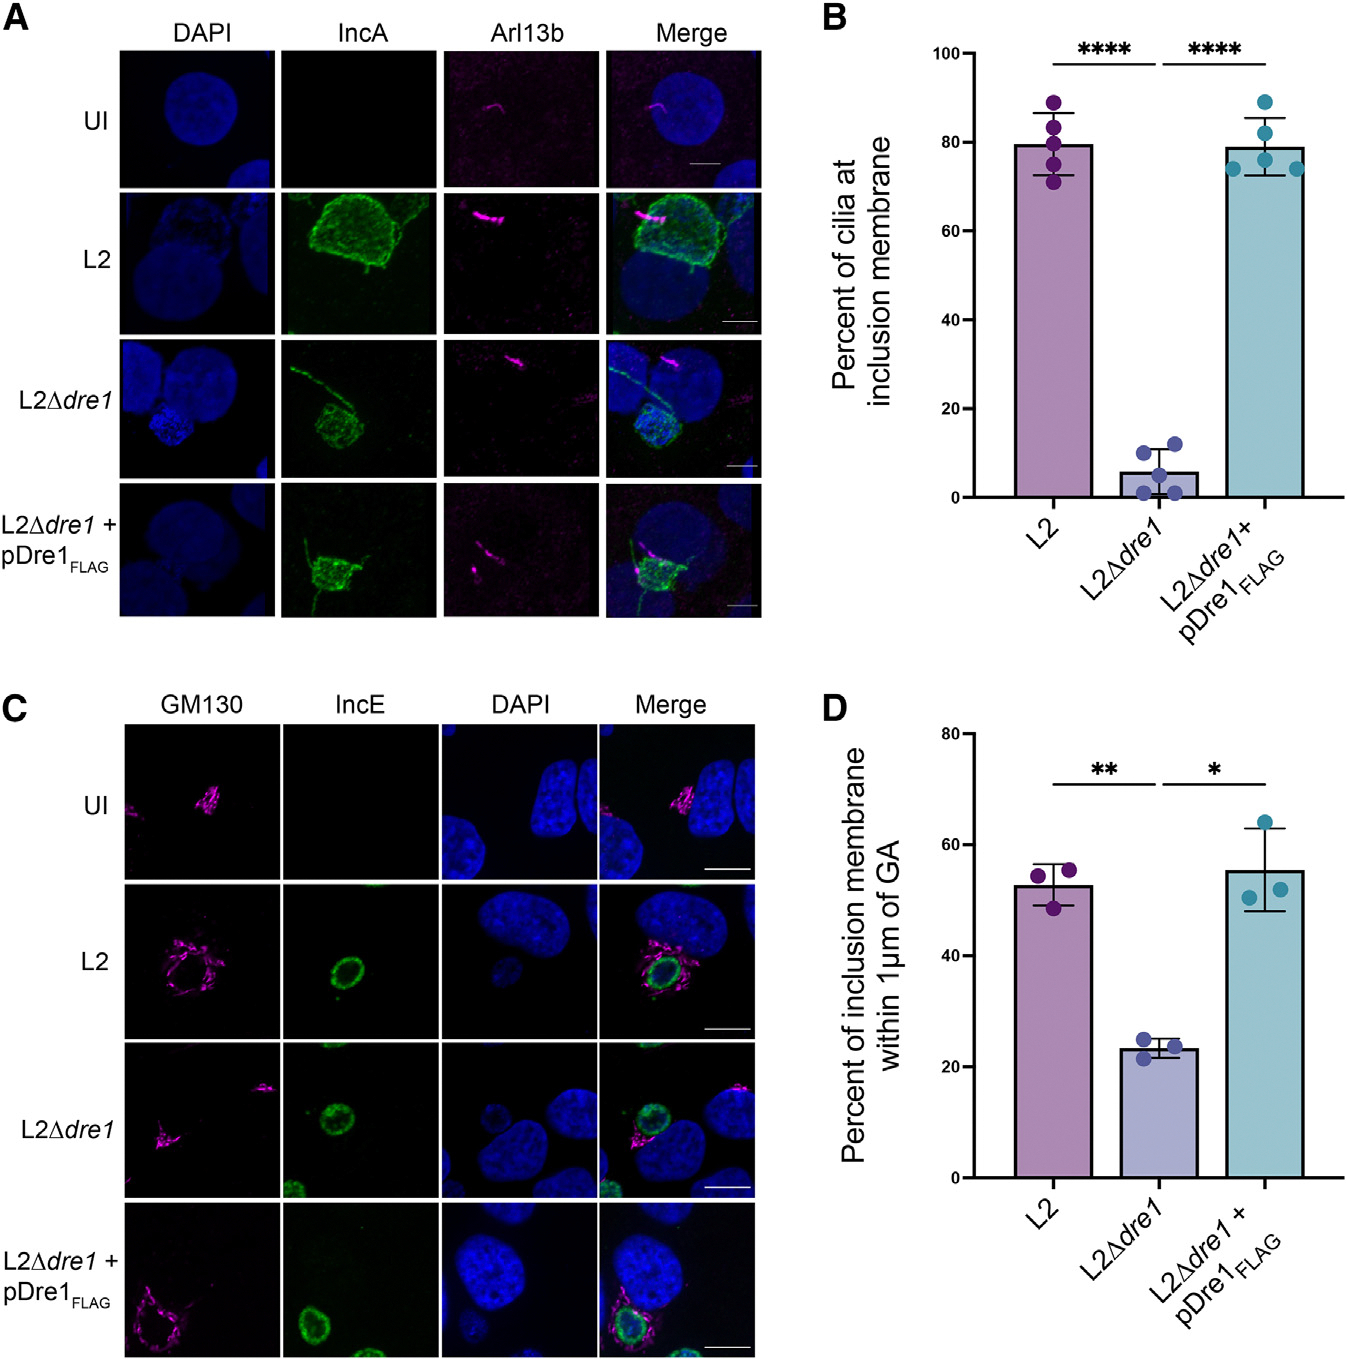
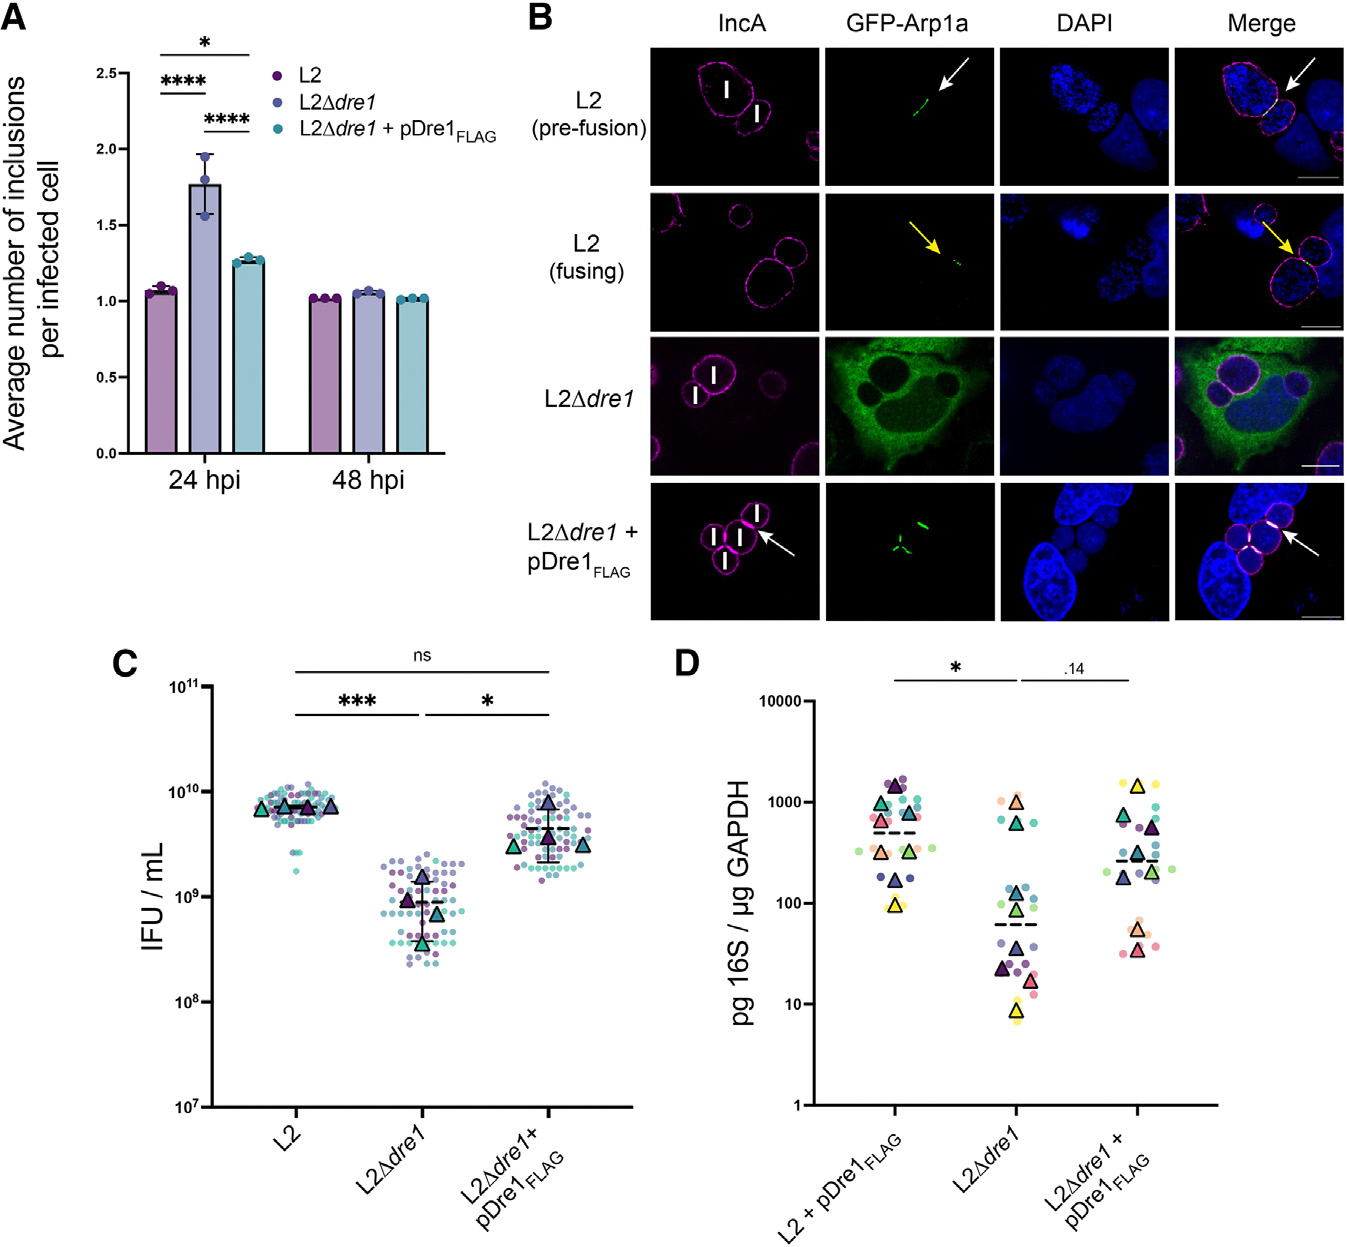
The obligate intracellular pathogen Chlamydia trachomatis replicates in a specialized membrane-bound compartment where it repositions host organelles during infection to acquire nutrients and evade host surveillance. We describe a bacterial effector, Dre1, that binds specifically to dynactin associated with host microtubule organizing centers without globally impeding dynactin function. Dre1 is required to reposition the centrosome, mitotic spindle, Golgi apparatus, and primary cilia around the inclusion and contributes to pathogen fitness in cell-based and mouse models of infection. We utilized Dre1 to affinity purify the megadalton dynactin protein complex and determined the first cryoelectron microscopy (cryo-EM) structure of human dynactin. Our results suggest that Dre1 binds to the pointed end of dynactin and uncovers the first bacterial effector that modulates dynactin function. Our work highlights how a pathogen employs a single effector to evoke targeted, large-scale changes in host cell organization that facilitate pathogen growth without inhibiting host viability.

Keywords: CP: Cell biology; CP: Microbiology; Chlamydia; Golgi apparatus; bacterial pathogenesis; centrosome; dynactin; host-pathogen interactions; microtubule organizing center; primary cilia.


Conflict of interest statement

Declaration of interests The Krogan Laboratory has received research support from Vir Biotechnology, F. Hoffmann-La Roche, and Rezo Therapeutics. N.J.K. has a financially compensated consulting agreement with Maze Therapeutics. He is the President of and is on the Board of Directors of Rezo Therapeutics, and he is a shareholder in Tenaya Therapeutics, Maze Therapeutics, Rezo Therapeutics, GEn1E Lifesciences, and Interline Therapeutics. R.H.V. is co-founder at Bloom Sciences (San Diego, CA, USA), a microbiome-based therapeutics company. The company was not involved in funding or interpreting the work presented.

Figures

Figure 1.
Figure 1.. Dynactin interacts with Dre1
(A) Schematic of orthogonal AP-MS screens to identify host binding partners of Dre1. (B) List of dynactin subunits that co-purified with transfected Dre1 in HEK293T cells and scored in the top 5% of all MiST (mass spectrometry interaction statistics) scores (descending order, transfection interactome) and of dynactin subunits that co-purified with Dre1 during C. trachomatis infection scored using the SAINT algorithm (descending order, infection interactome). Host protein scores marked with an asterisk are outside the top 5% or 10% of scores by MiST or SAINT, respectively. (C) Domain architecture of Dre1. Shown is the location of the premature stop codon (red arrow, stop sign) at amino acid 20 in the L2Δdre1 mutant. Transmembrane (TM) domain, gray; Dre1 Dynactin binding domain (DBD), dark green. (D) Dre1 is required for recruitment of transfected GFP-Arp1a to the inclusion. HeLa cells that were transfected with GFP-Arp1a (green) and infected for 24 h with the indicated strains were fixed and stained with anti-IncA (magenta, outlines the inclusion membrane) and counter-stained with DAPI (blue, to visualize the nucleus and bacteria). Shown are representative single Z slices. N, nucleus; I, inclusion. Scale bar, 10 μm. (E and F) Quantitation of (E) inclusion number and (F) inclusion area in HeLa cells infected with the indicated strains for 24 h. For (E), 35 fields per replicate for each condition were counted. For (F), 3D reconstructions for 35 inclusions per replicate for each condition were generated, and the area of each reconstructed inclusion was measured using Fiji. The inclusion area for each strain was normalized to the L2 inclusion area. Data are mean ± SD of three independent experiments. *p < 0.05, **p < 0.01, ***p < 0.001, Welch’s ANOVA; ns, not significant. See also Figures S1 and S2 and Tables S1 and S2.
Figure 2.
Figure 2.. The predicted structured subregions in the Dre1 C terminus are necessary for binding to dynactin
(A) Schematic showing transfected Dre1Strep variants used for AP. TM domain, gray; Dre1 DBD, dark green. (B) Immunoblot of Dre1Strep AP. HEK293T cells were transiently transfected with the indicated Dre1Strep constructs. Lysates were affinity purified with anti-Strep beads and immunoblotted with the indicated antibodies. Input represents 0.02% of lysates. Cells transfected with empty vector serve as a negative control. Data shown are representative of three independent biological experiments. The asterisk indicates a non-specific band found only in lysates. (C) Comparison of the amino acid sequence of the DBD in 3 of the C. trachomatis species that encode Dre1 homologs (serovars L2, A, and D) as well as C. suis (a pig-adapted species) and C. muridarum (a mouse-adapted species). Residues that comprise conserved regions 1 and 2 (CR1 and CR2) are shown boxed in green and blue, respectively. Conserved residues are highlighted in red, and residues that were mutated are indicated with a red asterisk. ESPript3.0 was used to render this alignment. Also shown is the secondary structure prediction of Dre1-DBD from C. trachomatis serovar L2. The predicted secondary structure of the strand (yellow) and coil (gray) are indicated. S4PRED was used to predict the secondary structure in the PSIPRED (position specific iterative [PSI]-blast-based secondary structure prediction) workbench. (D) Immunoblot of Dre1Strep variant AP. CR1 mutants: E193R, L194P, F195E, and L197W. CR2 mutants: E202P and V204P. CR1+2 mutants: E193R, L194P, F195E, L197W, E202P, and V204P. Data shown are representative of three independent biological experiments.
Figure 3.
Figure 3.. Cryo-EM structure of human dynactin affinity purified with Dre1 shows extra density at the pointed end that is consistent with Dre1
(A) Coomassie-stained SDS-PAGE of affinity-purified Dre1 and dynactin subunits. Left lane, size markers (kDa). Right lane, proteins that affinity purified with Dre183–231-Strep. (B) Raw cryo-EM micrograph and representative 2D class averages of human dynactin. (C) Schematic of the dynactin complex domain architecture showing dynactin subunits and p50 N-terminal extended regions (ERs) emerging from the shoulder and coating the Arp1 filament. (D) EM density maps of the two classes of dynactin complex purified, low-pass filtered at 7 Å, and fitted with the molecular model of human dynactin subunits. Insets showing the extra EM density at the pointed-end region (dashed red lines) indicate that Dre1 binds the pointed end of dynactin. See also Figures S3 and S4.
Figure 4.
Figure 4.. The Dre1 DBD is required for targeting dynactin to the centrosomal MTOC
(A and B) HeLa cells were transiently transfected with the indicated Dre1 constructs fused to sfGFP (green), counter-stained with DAPI (blue), and (A) stained with SiR-tubulin (magenta) to visualize MTs or (B) co-transfected with mCherry-Centrin 2 (pseudocolored magenta) to visualize the centrosome (indicated with white arrows). Single Z slices acquired by live-cell imaging are shown. Scale bar, 10 μm. See also Figure S5.
Figure 5.
Figure 5.. Dre1 modulates centrosome positioning during interphase and mitosis
(A) HeLa cells were infected for 36 h with the indicated strains or left uninfected (UI), fixed and co-stained with antibodies specific to Centrin (centrosome marker; magenta) and IncE (inclusion membrane marker, green), and counter-stained with DAPI (blue). Shown are single Z slices; arrows indicate centrosome position. Scale bar, 10 μm. (B) Centrosome-to-nucleus distance in UI cells and cells infected with the indicated strains 36 hpi was calculated from 3D reconstructions of z stacks. Shown are the individual values for the centrosome-to-nucleus distance for each strain (small colored circles) and average distance for each of three independent biological replicates (triangles, color coded by replicate). Averages ± SD of the biological replicates are represented as black bars. (C) Quantitation of centrosome spread. HeLa cells infected with the indicated strains for 36 h were stained with antibodies to Centrin or γ-tubulin and IncE. Centrosome spread (i.e., the area of the polygon required to encapsulate all centrosomes; Figure S6B) was calculated in >40 cells per condition over three independent biological replicates. Data are represented as mean ± SD. (D) HeLa cells were infected with the indicated strains or left UI for 24 h, fixed, co-stained with antibodies specific to p150glued (to visualize spindle poles, magenta) and IncE (to visualize the inclusion membrane, green), and counter-stained with DAPI (blue). Shown are single Z slices. Scale bar, 10 μm. (E) Quantitation of the percentage of mitotic cells with abnormal spindle formation 36 hpi. Spindles with >2 poles were scored as abnormal. 50 mitotic spindles were analyzed per condition over three independent biological replicates. For infected samples, only cells with inclusions were quantified. Data are represented as mean ± SD. *p < 0.05, **p < 0.01, ***p < 0.001, Welch’s ANOVA. See also Figure S6.
Figure 6.
Figure 6.. Dre1 repositions other dynactin-associated MTOCs
(A) A2EN cells were infected with the indicated L2 strains for 24 h, fixed, stained with antibodies to Arl13b (to visualize primary cilia, magenta) and IncA (to visualize the inclusion membrane, green), and counter-stained with DAPI (blue). Shown are single Z slices. Scale bar, 10 μm. In some images, previously described IncA-positive tubules (green) extending from the inclusion are present and are clearly distinct from the Arl13b-positive primary cilium (magenta). (B) The percentage of cilia anchored at the inclusion membrane from the four different conditions is shown. 25 ciliated cells per condition were analyzed over three biological replicates. Data are represented as mean ± SD. *p < 0.05, **p < 0.01, ***p < 0.001, ****p < 0.0001, Welch’s ANOVA. (C) HeLa cells were infected with the indicated strains or left UI for 24 h, fixed, co-stained with antibodies specific to GM130 (to visualize the GA, magenta) and IncE (green), and counter-stained with DAPI (blue). Shown are single Z slices. Scale bar, 10 μm. (D) Quantitation of GA recruitment to the inclusion recruitment in HeLa cells infected with the indicated strains for 24 h. For each condition, >100 infected cells across 3 independent biological replicates were counted, and the average of the three replicates ± SD is represented. *p < 0.05, **p < 0.01, Welch’s ANOVA. See also Figure S6.
Figure 7.
Figure 7.. Dre1 contributes to inclusion fusion and pathogen fitness
(A) Quantitation of inclusion fusion in HeLa cells 24 or 48 hpi. 120 cells were analyzed per condition over three biological replicates. Data are represented as mean ± SD. *p < 0.05, **p < 0.01, ***p < 0.001, ****p < 0.0001, Welch’s ANOVA. (B) Dynactin localizes at the boundary between closely apposed inclusions pre-fusion (white arrows) and at the boundary between inclusions undergoing fusion (yellow arrows) 24 hpi. HeLa cells were transfected with GFP-Arp1a (green), infected with the indicated strains for 24 h, fixed, stained with an antibody specific to IncA (to outline the inclusion, magenta), and counter-stained with DAPI (blue). Shown are single Z slices. Scale bar, 10 μm. (C) Quantitation of infectious progeny 48 hpi in HeLa cells infected with the indicated strains. Data are mean ± SD from ≥4 independent experiments presented as a scatterplot, where all data points (dots) and averages of each biological replicate (triangles) are color coded. *p < 0.05, **p < 0.01, ***p < 0.001, Welch’s ANOVA. (D) Dre1-deficient bacteria exhibit a decreased bacterial burden within the mouse upper genital tract 3 days post infection compared to bacteria expressing Dre1. Data are presented as a scatterplot, with technical replicates (dots) and average values for each mouse (triangles) color coded; n = 8 mice. *p < 0.05, Mann-Whitney U test. See also Figures S7 and S8.

Similar articles

Cited by

References

    1. Bennett JE, Dolin R, Blaser MJ, and Mandell D (2020). Bennett’s Principles and Practice of Infectious Diseases Ninth Edition (Elsevier; ).
    1. Zhu H, Shen Z, Luo H, Zhang W, and Zhu X (2016). Chlamydia Trachomatis Infection-Associated Risk of Cervical Cancer: A Meta-Analysis. Medicine 95, e3077. 10.1097/MD.0000000000003077. - DOI - PMC - PubMed
    1. Rey-Ladino J, Ross AGP, and Cripps AW (2014). Immunity, immunopathology, and human vaccine development against sexually transmitted Chlamydia trachomatis. Hum. Vaccin. Immunother 10, 2664–2673. 10.4161/hv.29683. - DOI - PMC - PubMed
    1. World Health Organization (2016). WHO guidelines for the treatment of chlamydia trachomatis (World Health Organization; ). https://iris.who.int/handle/10665/246165. - PubMed
    1. Elwell C, Mirrashidi K, and Engel J (2016). Chlamydia cell biology and pathogenesis. Nat. Rev. Microbiol. 14, 385–400. 10.1038/nrmicro.2016.30. - DOI - PMC - PubMed

LinkOut - more resources