. 2025 Jun;24(6):100961.
doi: 10.1016/j.mcpro.2025.100961. Epub 2025 Apr 3.

CellEKT: A Robust Chemical Proteomics Workflow to Profile Cellular Target Engagement of Kinase Inhibitors

Affiliations

CellEKT: A Robust Chemical Proteomics Workflow to Profile Cellular Target Engagement of Kinase Inhibitors

Joel Rüegger et al. Mol Cell Proteomics. 2025 Jun.

Abstract

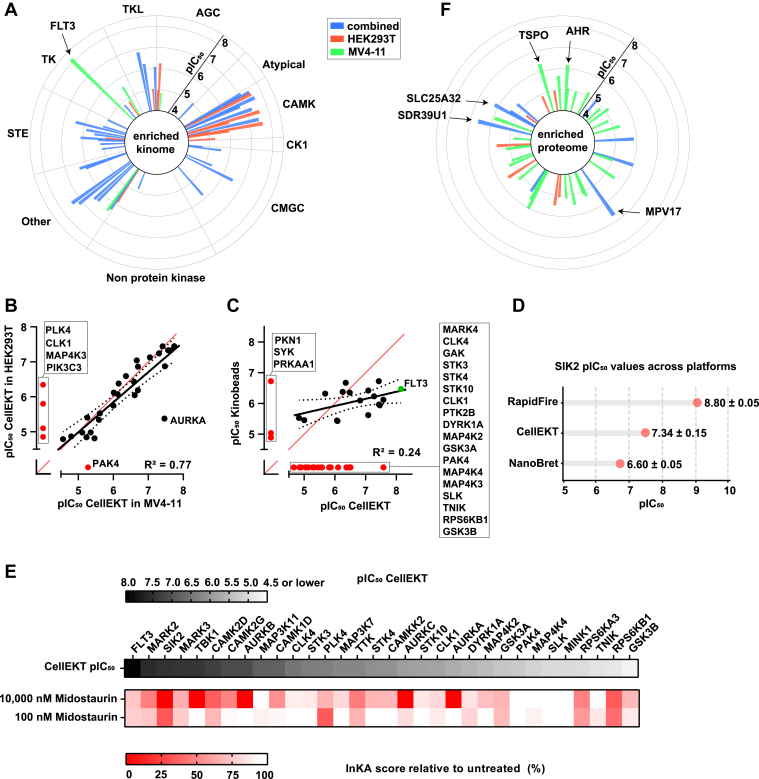
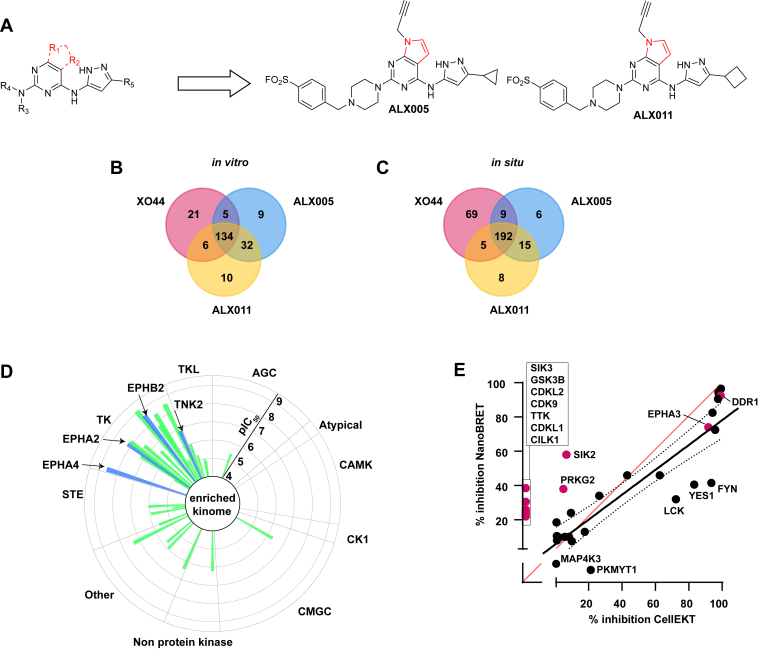
The human genome encodes 518 protein kinases that are pivotal for drug discovery in various therapeutic areas, such as cancer and autoimmune disorders. The majority of kinase inhibitors target the conserved ATP-binding pocket, making it difficult to develop selective inhibitors. To characterize and prioritize kinase-inhibiting drug candidates, efficient methods are desired to determine target engagement (TE) across the cellular kinome. In this study, we present CellEKT (Cellular Endogenous Kinase Targeting), an optimized and robust chemical proteomics platform for investigating cellular TE of endogenously expressed kinases using the sulfonyl fluoride-based probe XO44 and two new probes ALX005 and ALX011. The optimized workflow enabled the determination of the kinome interaction landscape of covalent and noncovalent drugs across over 300 kinases, expressed as IC50, which were validated using distinct platforms like phosphoproteomics and NanoBRET. With CellEKT, TE profiles were linked to their substrate space. CellEKT has the ability to decrypt drug actions and to guide the discovery and development of drugs.

Keywords: CellEKT; activity-based protein profiling; broad-spectrum kinase probes; cellular target engagement; chemical proteomics; endogenous kinome profiling.


Conflict of interest statement

Conflict of interest A. V., R. H., H. W., P. W., A. T., B. W., S. K., J. D. Z., U. G., and A. C. R. are employees of F. Hoffmann-La Roche Ltd. J. R., B. G. and M. v. d. S. are financially supported by F. Hoffmann-La Roche. Chemical probes ALX005 and ALX011 are filed as patent with J. R. and M. v. d. S. listed as inventors.

Figures

None
Graphical abstract
Fig. 1
Fig. 1
Overview of chemical proteomics workflow and identification of optimal cell lines.A, graphical representation of competitive chemical proteomics workflow. B, unique peptides detected of probe-enriched kinases per cell line tested. Proteomics data are from n = 3 biological replicates of 1 μM XO44. C, molecular function analysis of all probe-enriched proteins from all tested cell lines. Main molecular functions are displayed. D, kinase binding of 1 μM XO44 as determined by KINOMEscan assay (Eurofins). Lines represent median binding values per condition. E, Kinaseblender (48) analysis of kinome coverage when combining data from different cell lines. See also Supplemental Table S1.
Fig. 2
Fig. 2
Peptide library increases kinome coverage and optimized workflow overview.A, graphical representation of the peptide library. Creation of an experiment-specific peptide library, involving samples processed with high-probe concentration (10 μM) without inhibitors and samples with varying inhibitor concentrations and low-probe concentration (1 μM), enabling efficient peptide identification and enhanced kinase identification through the “MBR” function. B, probe-enriched kinases detected with high- and low-probe concentration. Increasing probe dose results in more detected kinases, indicating that at low-probe dose, these kinases are not efficiently engaged. Proteomics data are from n = 4 (1 μM XO44) and n = 2 (vehicle or 10 μM XO44) biological replicates. C, intensity-based absolute quantification (iBAQ) of probe-enriched kinases indicates kinases quantified only after matching with a peptide library have low abundance. D, comparing the intensities of matched peptides between replicates by Pearson's correlation indicates that matching with a peptide library results in reliable quantification results. See also Supplemental Table S3. E and F, comparing the results of pull-down experiments on HEK293T and MV4-11 cells using the old (30) and new workflow indicates a major improvement in kinome coverage with the same input material, resulting in 275 probe-enriched kinases in a single experiment. G, kinase coverage is around ∼50% across all kinases (protein kinases and metabolite kinases; Keyword: KW-0418, Organism: 9606, Reviewed) (2) and Manning (1) kinases. H, illustration of kinase coverage across the different kinase families. I, comparing biochemical binding of XO44 determined by KINOMEscan assay (Supplemental Table S2) and mRNA levels of kinases from the FANTOM5 dataset (51) creates overlap of kinases, which are expected (in vitro binding of >25% and gene expression level of >−2.5 log2 TPM) to be detected in a pulldown. Of those expected kinases, 55 to 64% are actually detected experimentally. See also Supplemental Tables S5 and S6. HEK293T, human embryonic kidney 293T cell line.
Fig. 3
Fig. 3
Testing midostaurin in the CellEKT assay and comparison to other profiling platforms.A, radar plot depicting the kinase targets and binding affinities of midostaurin identified with a good logarithmic fit (Supplemental Tables S5 and S6). Each spike represents one target that was measured at six different concentrations from 0.1 nM to 10,000 nM, and the data are presented as mean values of n = 2 biological replicates. The length of each spike indicates the determined pIC50 and the color in which cell line HEK293T (red), MV4-11 (green), or both cell lines (blue), target occupancy was determined. If target occupancy was determined in both cell lines the pIC50 values were averaged. B, correlation of kinase pIC50 of midostaurin between MV4-11 and HEK293T in CellEKT assay. Kinases that were not found to be inhibited are marked in red and displayed in the corresponding box, sorted in descending order of pIC50 value. C, correlation of kinase pIC50 values of midostaurin between CellEKT (pIC50 determined in MV4-11 and HEK293T combined and averaged) and Kinobeads assay (10). Kinases that were not found to be inhibited are marked in red and displayed in the corresponding box, sorted in descending order of pIC50 value. Main target is illustrated in green. The red lines depict lines of unity. D, comparison of determined pIC50 values of midostaurin on SIK2 using the RapidFire, chemical proteomics, and NanoBRET platforms. E, comparison of determined pIC50 values using CellEKT, as determined in a full dose–response curve, with the effects on kinase activity and kinase substrates (INKAscore) (43) as determined by phosphoproteomics (Supplemental Table S9), conducted in n = 2 biological duplicates for each concentration. F, radar plot illustrating the targets and binding affinities of midostaurin across the enriched proteome, with the kinome excluded. CellEKT, Cellular Endogenous Kinase Targeting; HEK293T, human embryonic kidney 293T cell line.
Fig 4
Fig 4
Selectivity profile of BTK inhibitors in the CellEKT assay and comparison to other profiling platforms.A, chemical structures of ibrutinib, zanubrutinib, and acalabrutinib. B, full dose–response curve of TEC (Supplemental Table S7) as determined in HEK293T and of BTK as determined in MV4-11 cells (Supplemental Table S8) for ibrutinib, zanubrutinib, and acalabrutinib. Target engagement is determined at six different concentrations from 0.1 nM to 10,000 nM, and data is presented as mean values ± SEM of n = 2 biological replicates. C, comparison of kinase % inhibition by CellEKT (Supplemental Tables S7 and S8) and % inhibition at 1 μM inhibitor concentration determined by KINOMEscan assay (Supplemental Table S2). For the CellEKT analysis, if a pIC50 was determined in both cell lines, the values were averaged. The determined pIC50 values measured by CellEKT were transformed to % inhibition by: % Inhibition = ([I]/[I] + 10−pIC50) × 100 with inhibitor concentration [I] = 1 μM to match the concentration at which the KINOMEscan assay was performed. D, correlation plot comparing the KiNative dataset (7) with the percentage inhibition determined by CellEKT for ibrutinib at 1000 nM. The determined pIC50 values measured by CellEKT were transformed to % inhibition by: % Inhibition = ([I]/[I] + 10−pIC50) × 100 with inhibitor concentration [I] = 1000 nM to match the concentration at which the KiNative profiling was performed. Kinases that were found not inhibited but are identified by the corresponding platform are marked in red. Main target is illustrated in green. E, correlation of kinase pIC50 values for ibrutinib between CellEKT (pIC50 determined from combined and averaged data in MV4-11 and HEK293T) and Kinobeads data, where inhibitor treatment was conducted in (E) lysate (10) and (F) live cells (58). The red lines depict lines of unity. BTK, Bruton's tyrosine kinase; CellEKT, Cellular Endogenous Kinase Targeting.
Fig 5
Fig 5
Profiling of ALX005/ALX011 and kinome-wide analysis using a probe cocktail to evaluate the selectivity profile of dasatinib.A, chemical structures of ALX005 and ALX011 derived from pyrrolo-pyrimidine core and XO44. B, shared and unique kinases with ≥50% inhibition at 1 μM as determined by KINOMEscan assay (Supplemental Table S2). C, shared and enriched kinases across MV4-11 and HEK293T as determined by CellEKT (Supplemental Table S10). D, radar plot depicting the kinase targets and binding affinities of dasatinib determined in MV4-11 identified with a good logarithmic fit (Supplemental Table S11). Each spike represents one target, which was measured at six different concentrations from 0.1 nM to 10,000 nM, and the data are presented as mean values of n = 2 biological replicates. The length of each spike indicates the determined pIC50. The targets identified exclusively by ALX005 and/or ALX011, as depicted in C, and demonstrating target occupancy with dasatinib are highlighted in blue. E, correlation plot comparing the percentage inhibition determined by NanoBRET (16) with the percentage inhibition determined by CellEKT. The target occupancy of dasatinib was determined at 100 nM with NanoBRET. The determined pIC50 values measured by CellEKT were transformed to % inhibition by: % Inhibition = ([I]/[I] + 10−pIC50) × 100 with inhibitor concentration [I] = 100 nM. Kinases that were found inhibited across both platforms are illustrated in black with R2 = 0.81. Kinases measured by NanoBRET that are not inhibited in the CellEKT assay, or have a poor logarithmic fit, are illustrated in pink. The red line depicts the line of unity. CellEKT, Cellular Endogenous Kinase Targeting.
Fig 6
Fig 6
Expansion of the kinase–substrate coverage.A, upset plot showing kinases covered by this work compared with kinase–substrate atlas (KSA) (32, 33). The upper bar plot shows the intersection sizes, highlighting the number of kinases uniquely identified in this work, those covered by both, and those exclusive to KSA. The lower plot presents the overall counts of kinases covered by each study and their overlap. B, coverage of known serine/threonine and tyrosine phosphosites from high (60) and low-throughput (61) approaches. A substrate was considered confidently covered by a kinase if the kinase was found in the 90th percentile according to the scoring and percentile ranking from kinase–substrate atlas (32, 33). C, t-SNE plot of kinases clustered by their amino-acid sequence preference. Each dot represents a kinase, colored orange if only covered by KSA, and green if covered by both this work and KSA. Known families of kinases are highlighted with dashed circles and labeled using reference colors from the phylogenetic tree of the human kinome. t-SNE, t-distributed stochastic neighbor embedding.
None
None
None
None
None
None
None

References

    1. Manning G., Whyte D.B., Martinez R., Hunter T., Sudarsanam S. The protein kinase complement of the human genome. Science. 2002;298:1912–1934. - PubMed
    1. Consortium T.U., Bateman A., Martin M.-J., Orchard S., Magrane M., Ahmad S., et al. UniProt: the Universal protein knowledgebase in 2023. Nucleic Acids Res. 2022;51:D523–D531. - PMC - PubMed
    1. Ferguson F.M., Gray N.S. Kinase inhibitors: the road ahead. Nat. Rev. Drug Discov. 2018;17:353–377. - PubMed
    1. Roskoski R. Properties of FDA-approved small molecule protein kinase inhibitors: a 2024 update. Pharmacol. Res. 2024;200 - PubMed
    1. Davis M.I., Hunt J.P., Herrgard S., Ciceri P., Wodicka L.M., Pallares G., et al. Comprehensive analysis of kinase inhibitor selectivity. Nat. Biotechnol. 2011;29:1046–1051. - PubMed

LinkOut - more resources