. 2025 Apr 5;16(1):3269.
doi: 10.1038/s41467-025-57837-z.

scRNA-seq uncovers the transcriptional dynamics of Encephalitozoon intestinalis parasites in human macrophages

Affiliations

scRNA-seq uncovers the transcriptional dynamics of Encephalitozoon intestinalis parasites in human macrophages

Pattana Jaroenlak et al. Nat Commun. .

Abstract

Microsporidia are single-celled intracellular parasites that cause opportunistic diseases in humans. Encephalitozoon intestinalis is a prevalent human-infecting species that invades the small intestine. Macrophages are potential reservoirs of infection, and dissemination to other organ systems is also observed. The macrophage response to infection and the developmental trajectory of the parasite are not well studied. Here we use single cell RNA sequencing to investigate transcriptional changes in both the parasite and the host during E. intestinalis infection of human macrophages in vitro. The parasite undergoes large transcriptional changes throughout the life cycle, providing a blueprint for parasite development. While a small population of infected macrophages mount a response, most remain transcriptionally unchanged, suggesting that the majority of parasites may avoid host detection. The stealthy microsporidian lifestyle likely allows these parasites to harness macrophages for replication. Together, our data provide insights into the host response in primary human macrophages and the E. intestinalis developmental program.


Conflict of interest statement

Competing interests: The authors declare no competing interests.

Figures

Fig. 1
Fig. 1. E. intestinalis infection kinetics in primary human macrophages.
ae Representative confocal microscopy images of primary human macrophages infected with E. intestinalis at 3 (a), 12 (b), 24 (c), 48 (d) and 72 (e) hours post infection (hpi). A single mature spore positive for chitin (orange) depicts phagocytosis of the spore by the macrophage (arrowheads). A cluster of DNA-only positive foci (magenta) represents parasites actively proliferating inside of the macrophage (c) (arrow). A mixture of parasites positive for DNA and chitin staining, and DNA-only staining represents macrophages with developing spores (arrow) (d-e). Micrographs are representative of at least 4 biological replicates at each time point. f Quantification of macrophages with active infection, corresponding to representative images in (ce). Mean ± SD are from eight biological replicates for 24 hpi, six biological replicates for 48 hpi, and four biological replicates for 72 hpi. n = 100 cells per experiment. Source data are provided in the Source Data file.
Fig. 2
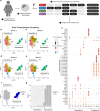
Fig. 2. Transcriptional analysis of macrophages infected with E. intestinalis.
a Schematic overview of the experimental workflow for scRNAseq. Primary human PBMCs were collected from 4 healthy donors, differentiated into macrophages, and infected with E. intestinalis for 3, 12, 24, 48, or 72 h. Uninfected cells served as controls. Cells were then prepared and taken through the scRNAseq workflow. be UMAP plots of the integrated cells from donors projecting cells from Donors 1–4. f UMAP plot of the integrated cells from Donors 1–4 colored by uninfected (gray; Population A) vs infected (blue; Population B). A cell is scored as infected if >2% of total transcripts in the cell were derived from E. intestinalis. g Quantification of the percentage of infected cells in each cluster (h). Dotplot of the top 5 genes expressed in each cluster. The X axis shows the clusters and the Y axis shows the genes. The color indicates the average expression level across the cells in each cluster and the size indicates the percentage of cells in each cluster expressing that gene. Source data are provided in the Source Data file.
Fig. 3
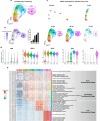
Fig. 3. Dynamics of E. intestinalis gene expression during parasite development.
a UMAP plot of parasite-only transcripts from Donors 1–4. Each cluster corresponds to a stage of parasite development. b UMAP projection of the percentage of parasite reads in a cell (left), and the percentage of parasite transcripts quantified per cluster (right). c UMAP plot separated by time point reveals parasite development trajectory. d Violin plots representing the expression of the top differentially expressed genes across clusters. e Heatmap of differentially expressed genes in each cluster over the parasite life cycle. The color indicates relative gene expression, with red indicating increased expression. The panel on the right depicts known protein products and their role during development. The bolded protein products correspond to the genes shown in (d). Source data are provided in the Source Data file.
Fig. 4
Fig. 4. Cluster P4 is enriched in proteins containing signal peptides and Ricin-B domains.
a Schematics of representative proteins containing a Ricin-B domain and an N-terminal signal peptide (top) and proteins containing a Ricin-B domain fused to an integral membrane protein (bottom). b Heatmap depicting the expression of genes in cluster P4 containing a Ricin-B domain and/or a signal peptide. c Schematic of the assay we developed to test secretion. Constructs containing the first 40 amino acids of each protein from (b) fused to the N-terminus of GFP were transfected into Expi293 cells, alongside control constructs. Supernatants and whole cell lysates were collected and analyzed via western blot, including lysis controls. d Western blot of supernatants (top) and whole cell controls (bottom) from panel (c), probing GFP and GAPDH. Three biological replicates were performed. e Representative immunofluorescence microscopy images of germinated E. intestinalis spores stained for PTP2 (magenta; known polar tube protein) and Eint_070340 (green; upregulated in cluster P4 and predicted to be secreted). Colocalization analysis reveals staining of the polar tube by PTP2 and Eint_070340. Areas of co-localization are indicated in white. PTP2 and Eint_070340 have an average correlation coefficient of 0.3228. f Quantification of the percentage of polar tubes (PT) that are fully stained, partially stained, or not stained by anti-PTP2 and anti-Eint_070340. Mean ± SD are from three biological replicates. n = 100 spores per experiment. Source data are provided in the Source Data file.
Fig. 5
Fig. 5. Transcriptional analysis of the host response to E. intestinalis infection.
a UMAP plots of host-only transcripts projecting uninfected cells (left) and all cells (right) from Donors 1–4. b UMAP plot colored by uninfected cell (gray) or infected (blue) cells. A cell is scored as infected if >2% of total transcripts in the cell were derived from E. intestinalis. c Quantification of the percentage of infected cells in each cluster. d Dotplot of the top 10 genes expressed in each cluster. The X axis shows the genes and the Y axis shows the clusters. The color indicates the average expression level across the cells in each cluster and the size indicates the percentage of cells in each cluster expressing that gene. e, f Violin plots showing expression levels of top genes from clusters H5 (e) and H3 (f). g, h Bar plots showing −log10(p-value) from enrichment analysis of biological pathways on clusters H5 and H3 using the Molecular Signatures DataBase (MSigDB) hallmark gene sets. The p-value is calculated using the Enrichr Fisher’s exact test with multiple hypothesis correction using BH approach. i Quantification of the percentage of parasite developmental stages found within the human-only clusters. Source data are provided in the Source Data file.
Fig. 6
Fig. 6. Host-parasite transcriptional atlas.
a Developmental program of E. intestinalis. Molecular markers for each parasite stage in red. b Schematics of the host response to E. intestinalis infection. E. intestinalis infection goes undetected in the majority of cells and the parasites are able to undergo their full lifecycle (top). A subset of host cells are able to respond to infection (cluster H5) particularly when the parasites mature into late stage spores (middle). These cells are undergoing cell death to limit infection and spread. Bystander cells are responding to secreted interferons from infected cells and creating an antiviral cell state to try to prevent infection (bottom).

Update of

Similar articles

Cited by

References

    1. Lee, S. C. et al. Microsporidia evolved from ancestral sexual fungi. Curr. Biol.18, 1675–1679 (2008). - PMC - PubMed
    1. Mascarenhas Dos Santos, A. C., Julian, A. T., Liang, P., Juárez, O. & Pombert, J.-F. Telomere-to-Telomere genome assemblies of human-infecting Encephalitozoon species. BMC Genomics24, 237 (2023). - PMC - PubMed
    1. Tamim El Jarkass, H. & Reinke, A. W. The ins and outs of host-microsporidia interactions during invasion, proliferation and exit. Cell. Microbiol.22, e13247 (2020). - PubMed
    1. Seatamanoch, N., Kongdachalert, S., Sunantaraporn, S., Siriyasatien, P. & Brownell, N. Microsporidia, a highly adaptive organism and its host expansion to humans. Front. Cell. Infect. Microbiol.12, 924007 (2022). - PMC - PubMed
    1. Smith, R. et al. Three cases of neurologic syndrome caused by donor-derived microsporidiosis. Emerg. Infect. Dis. J.23, 387–395 (2017). - PMC - PubMed

MeSH terms

LinkOut - more resources