. 2025 Apr 5;16(1):3258.
doi: 10.1038/s41467-025-58554-3.

A differential requirement for ciliary transition zone proteins in human and mouse neural progenitor fate specification

Affiliations

A differential requirement for ciliary transition zone proteins in human and mouse neural progenitor fate specification

Antonia Wiegering et al. Nat Commun. .

Abstract

Studying ciliary genes in the context of the human central nervous system is crucial for understanding the underlying causes of neurodevelopmental ciliopathies. Here, we use pluripotent stem cell-derived spinal organoids to reveal distinct functions of the ciliopathy gene RPGRIP1L in humans and mice, and uncover an unexplored role for cilia in human axial patterning. Previous research has emphasized Rpgrip1l critical functions in mouse brain and spinal cord development through the regulation of SHH/GLI pathway. Here, we show that RPGRIP1L is not required for SHH activation or motoneuron lineage commitment in human spinal progenitors and that this feature is shared by another ciliopathy gene, TMEM67. Furthermore, human RPGRIP1L-mutant motoneurons adopt hindbrain and cervical identities instead of caudal brachial identity. Temporal transcriptome analysis reveals that this antero-posterior patterning defect originates in early axial progenitors and correlates with cilia loss. These findings provide important insights into the role of cilia in human neural development.


Conflict of interest statement

Competing interests: The authors declare no competing interests.

Figures
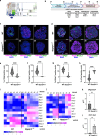
Fig. 1
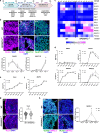
Fig. 1. Rpgrip1l-deficient mouse spinal progenitors fail to adopt SHH-dependent ventral fates.
a Diagram depicting the main transcription factors spanning the different dorso-ventral progenitor (light blue) or neuronal (light green) domains of the developing spinal cord. FP: floor plate. p0-p2, pMN and p3: ventral spinal progenitor domains. V0-V2, MN, V3: ventral spinal neuronal domains. b Schematic summary of the spinal 3D differentiation approach. The main neural progenitor and neuronal populations obtained at each time point with their molecular markers are indicated at the bottom. Small molecules used to induce or repress signaling pathways are indicated on top. CHIR: WNT agonist CHIR99021; SAG: SHH agonist; RA: Retinoic Acid. Modified after Duval et al.. c Immunofluorescence for Olig2 (pMN) and Islet1 (post-mitotic MNs) in sections from WT and Rpgrip1l-/- organoids at indicated time points. d: day of differentiation. d Immunofluorescence for Nkx6.1 (p3-pMN-p2), Olig2 (pMN), Nkx2.2 (p3), Foxa2 (FP) and Pax6 (pMN-dp) on sections from WT and Rpgrip1l-/- organoids at indicated time points. In (c and d) nuclei are stained with DAPI. Scale bars: 50 μm. eh Violin plots quantifying the percentage of nuclei per organoids stained for the selected markers on sections from WT and Rpgrip1l-/- organoids at indicated time points. The median and quartiles are represented by dotted lines. Statistics: two-sided unpaired t tests with Welch’s correction (e p = 0.0003; fh p < 0.0001). N = 4 (e, f) or N = 3 (g, h) independent experiments; n = 1 clone per genotype. i, j Heatmap from bulk RNAseq data based on mean values of log2(tpm+1) for selected genes in WT and Rpgrip1l KO spinal organoids over time. N = 3 independent experiments for each time point; n = 1 clone per genotype. k, l qPCR analysis for Olig2 and Dbx1 in WT and Rpgrip1l-/- organoids at day 4. Data shown as mean ± SEM. Statistics: two-sided Mann-Whitney test (p = 0.0079). N = 5 independent experiments, n = 1 clone per genotype.
Fig. 2
Fig. 2. Rpgrip1l-deficient mouse spinal organoids fail to activate the SHH pathway and lack functional cilia.
a, b Relative fold-change for Gli1 and Ptc1 expression in WT and Rpgrip1l-/- organoids at indicated time points. Data shown as mean ± SEM. Statistics: multiple two-sided Mann-Whitney tests (p = 0.028571). N = 4 independent experiments; n = 1 clone per genotype. c Immunofluorescence for the indicated ciliary markers on WT and Rpgrip1l-deficient day 5 organoids. Cilia are present at apical sites pointing outside or into inner cavities of the organoids. Scale bar: 2 μm. d Percentage of Arl13b positive cilia. Data shown are mean ± SEM. Statistics: two-sided unpaired t tests with Welch’s correction (p < 0.0001). N = 2 independent experiments; n = 1 clone per genotype. e Length of Ift88 staining. Data shown are mean ± SEM. Statistics: two-sided unpaired t tests with Welch’s correction (p = 0.0002). N = 2 independent experiments; n = 1 clone per genotype. f Western-Blot for Rpgrip1l and Actin on WT and Rpgrip1l KO mouse ES cells. N = 2 independent experiments.
Fig. 3
Fig. 3. RPGRIP1L-deficient hiPSC-derived spinal organoids adopt the MN fate.
a Schematic summary of the spinal 3D differentiation approach. Main neural progenitor and neuron populations obtained at each time point with their molecular markers are indicated at the bottom. Drugs used to induce or repress signaling pathways are indicated on top. SB and LDN: SMAD antagonists SB-431542 and LDN-193189; CHIR: WNT agonist CHIR99021; SAG: SHH agonist; DAPT: NOTCH agonist; RA: Retinoic Acid. Modified after Maury et al.. b Immunofluorescence analysis of pMN (OLIG2) and MN (ISLET1/2) production in WT and RPGRIP1L-/- spinal organoids. Quantifications show relative OLIG2 and ISLET1/2 positive areas per organoid over time. Data are shown as mean ± SEM. Asterisks denote statistical significance according to unpaired t tests with Welch’s correction (p = 0.0267). c Heatmap of selected gene expressions from bulk RNAseq data based on log2(tpm+1) values of WT and RPGRIP1L-deficient spinal organoids over time. d Log2(tpm+1)-graphs illustrate the dynamic expression levels of DBX2, OLIG2, NKX6.1 and NKX2.2 in WT and RPGRIP1L-/- organoids. Data are shown as mean ± SEM. e, f Log2(tpm+1) data from bulk RNASeq analyzes show TUJ1 and MAP2 expression in WT and RPGRIP1L-deficient organoids during differentiation. Data are shown as mean ± SEM. g Immunofluorescence analysis of TUJ1 on day 14. Data are shown as median with quartiles. Unpaired t test with Welch’s correction was performed for statistical analysis. h Immunofluorescence analysis of OLIG2-positive MN progenitors and NKX2.2-positive spinal progenitors at day 9 and day 11. Data are shown as mean ± SEM. Unpaired t tests with Welch’s correction was performed for statistical analysis (p = 0.0141). bh N: number of independent experiments; n: number of different clones analyzed per experiment. For b, g and h, 2 WT clones and 2 KO clones from each line (n = 4 for each genotype). For cf, 2 WT clones and 1 KO clone from each line (n = 4 for WT and n = 2 for KO). N = 3 in b, g; N = 2 in h; N = 1 in (cf). Scale bars: 50 µm in (b and h), 100 µm in j.
Fig. 4
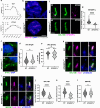
Fig. 4. RPGRIP1L-deficient hiPSC-derived neural progenitors harbor cilia and transduce SHH signaling.
a Log2(tpm+1) data from bulk RNASeq analysis show expression profiles of GLI1 and PTCH1 as mean ± SEM. b, c Immunofluorescence analysis of ciliary proteins in WT and RPGRIP1L-deficient spinal organoids at day 6. b Cilia are labeled by ARL13B and basal bodies by γ-TUBULIN. c Cilia are labeled by IFT81 in green. d, e Cilia length and density measurements in WT and RGPRIP1L-/- organoids at day 6. Data are shown as median with quartiles. Mann-Whitney test was performed for statistical analyzes. f Stimulated-Emission-Depletion (STED) images of WT and RPGRIP1L-deficient cilia at day 6. Cilia are labeled by ARL13B and RPGRIP1L. g Quantification of the ciliary RPGRIP1L amount based on confocal images. Data are shown as median with quartiles. Statistics: unpaired t tests with Welch’s correction (p < 0.0001). h, i Immunofluorescence of WT and RPGRIP1L-deficient cilia on spinal organoids at day 6. Cilia are labeled by ARL13B and AC3 (h) or by ARL13B and INPP5E (i). Basal bodies are labeled by γ-TUBULIN. j, k, l Quantifications of ciliary ARL13B (j), AC3 (k) and INPP5E (l) amounts in WT and RPGRIP1L-deficient organoids. Data are shown as median with quartiles. Statistics: unpaired t tests with Welch’s correction (p < 0.0001). a-l N: number of independent experiments; n: number of different WT or KO clones analyzed per experiment. For a, 2 WT clones and 1 KO clone from each iPSC line (n = 4 for WT and n = 2 for KO). For d, e, g and jl, 2 WT clones and 2 KO clones from each line (n = 4 for each genotype). N = 3 for (d, e, g, j-l); N = 1 for a. Scale bars: 300 µm in b; 0.5 µm in c; 1 µm in h, i.
Fig. 5
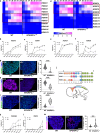
Fig. 5. RPGRIP1L-deficient spinal organoids show antero-posterior patterning defects with MNs adopting hindbrain identity.
a, d Heatmaps showing HOXA (a) and HOXC (d) gene expression in WT and RPGRIP1L-deficient spinal organoids over time. The graphs were generated from log2(tpm+1) files of bulk RNASeq analysis. b, c, e, f Log2(tpm+1) graphs show the expression profiles of selected HOX genes HOXA5 (b), HOXA7 (c), HOXC4 (e) and HOXC8 (f) over time. Data are shown as mean ± SEM. g, h, i Immunofluorescence of HOX proteins in WT and RPGRIP1L-deficient spinal organoids at day 14. Quantifications show the percentage of HOXA7 (g) HOXC8 (h) and HOXA5 (i) positive nuclei per organoid. Data are shown as median with quartiles. Statistics: unpaired t tests with Welch’s correction (p < 0.0001). j Schematic overview about the three HOX gene clusters expressed in MNs from anterior to posterior positions. The black and gray-dotted squares indicate the genes expressed in WT and RPGRIP1L-deficient spinal organoids, respectively. k, l Log2(tpm+1) graphs generated from bulk RNASeq analyzes show the expression profiles of PHOX2B and TBX20. Data are shown as mean ± SEM. m Immunofluorescence of PHOX2B in WT and RPGRIP1L-deficient spinal organoids at day 14. Quantifications show the percentage of PHOX2B positive nuclei per organoid. Data are shown as median with quartiles. Statistics: unpaired t tests with Welch’s correction (p = 0.0004). am N: number of independent experiments; n: represents the number of different WT or KO clones analyzed per experiment. For (af), k and l, 2 WT clones and 1 KO clone from each line (n = 4 for WT and n = 2 for KO). For gi and m, 2 WT clones and 2 KO clones from each line (n = 4). N = 3 in gi, m; N = 1 in af, k, l. Scale bars: 500 µm in g, h, i and m.
Fig. 6
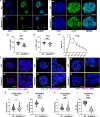
Fig. 6. Altered axial patterning and reduced ciliogenesis in early RPGRIP1L-deficient progenitors.
a, c Immunofluorescence of CDX2 in WT and RPGRIP1L-deficient spinal organoids at day 2 (a) and day 4 (c). b, d Quantifications show the percentage of CDX2 positive nuclei per organoid at day 2 (b) and day 4 (d). Data are shown as median with quartiles. Statistics: unpaired t tests with Welch’s correction with (b) p = 0.0007 and (d) p = 0.0003. e Log2(tpm+1) graph generated from bulk RNASeq analyzes show the dynamic expression profile of CDX2. Data are shown as mean ± SEM. f, i, j Immunofluorescence of cilia in WT and RPGRIP1L-deficient spinal organoids at (f) day 2 and (i, j) day 4. Cilia are labeled by (f, i) ARL13B and INPP5E or by (j) IFT81 and ARL13B. Magnified areas are indicated by yellow rectangles and magnified images are displayed on the right. Scale bars: 5 µm. g, h, k, l Cilia length and cilia density measurements in WT and RPGRIP1L-/- organoids at day 2 and day 4. Data are shown as median with quartiles. Statistics: g, k Mann-Whitney (p = 0.0007) and h, l unpaired t tests with Welch’s correction (p < 0.0001). a-l N: number of independent experiments; n: number of different WT or KO clones analyzed per experiment. For b, d, g, h, k and l, 2 WT clones and 2 KO clones from each line (n = 4). For e, 2 WT clones and 1 KO clone from each line (n = 4 for WT and n = 2 for KO). N = 2 (except for 1 KO N = 1) for b; N = 3 for d; N = 1 for e, g, h, k, l. Scale bars: 150 µm in a, c, f, i and j.

References

    1. Bachmann-Gagescu, R. et al. Healthcare recommendations for Joubert syndrome. Am. J. Med. Genet. A182, 229–249 (2020). - PMC - PubMed
    1. Reiter, J. & Leroux, M. Genes and molecular pathways underpinning ciliopathies. Nat. Rev. Mol. Cell Biol.18, 533–547 (2017). - PMC - PubMed
    1. Brancati, F., Dallapiccola, B. & Valente, E. Joubert Syndrome and related disorders. Orphanet J. Rare Dis.5, 20 (2010). - PMC - PubMed
    1. Goetz, S. & Anderson, K. The primary cilium: a signalling centre during vertebrate development. Nat. Rev. Genet.11, 331–344 (2010). - PMC - PubMed
    1. Spassky, N. et al. Primary cilia are required for cerebellar development and Shh-dependent expansion of progenitor pool. Dev. Biol.317, 246–259 (2008). - PMC - PubMed

MeSH terms

Substances

LinkOut - more resources