. 2025 Apr 5;16(1):3261.
doi: 10.1038/s41467-025-58413-1.

Cytogenetic signatures favoring metastatic organotropism in colorectal cancer

Affiliations

Cytogenetic signatures favoring metastatic organotropism in colorectal cancer

Mariola Monika Golas et al. Nat Commun. .

Abstract

Colorectal carcinoma (CRC) exhibits metastatic organotropism, primarily targeting liver, lung, and rarely the brain. Here, we study chromosomal imbalances (CIs) in cohorts of primary CRCs and metastases. Brain metastases show the highest burden of CIs, including aneuploidies and focal CIs, with enrichment of +12p encoding KRAS. Compared to liver and lung metastases, brain metastases present with increased co-occurrence of KRAS mutation and amplification. CRCs with concurrent KRAS mutation and amplification display significant metabolic reprogramming with upregulation of glycolysis, alongside upregulation of cell cycle pathways, including copy number gains of MDM2 and CDK4. Evolutionary modeling suggests early acquisition of many organotropic CIs enriched in both liver and brain metastases, while brain-enriched CIs preferentially emerge later. Collectively, this study supports a model where cytogenetic events in CRCs favor site-specific metastatic colonization. These site-enriched CI patterns may serve as biomarkers for metastatic potential in precision oncology.


Conflict of interest statement

Competing interests: The authors are not aware of any conflict of interest related to this study.

Figures
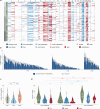
Fig. 1
Fig. 1. Pattern of CIs observed in the CRCTropism cohort.
a Chromosomal losses and gains in shades of blue and red, respectively, observed in the cohort with 314 tumors, including n = 80 primary CRC and n = 234 distant CRC metastases in the liver, lung, and brain. On the left, tumor site and sex are color-encoded according to the legend. b Number of apparent chromosomal arm aneuploidies in relation to focal CIs, visualized as a stacked bar chart (n = 234). c Distribution of chromosomal arm aneuploidies in CRC metastases (n = 191). (1) padjust = 2.96 × 10−3; (2) padjust = 6.94 × 10−6; (3) padjust = 1.31 × 10−2. d Distribution of CIs including losses and gains for CRC metastases (n = 191). (1) padjust = 2.46 × 10−3; (2) padjust = 1.37 × 10−6; (3) padjust = 5.57 × 10−3; (4) padjust = 3.70 × 10−4; (5) padjust = 5.96 × 10−3; (6) padjust = 1.44 × 10−4; (7) padjust = 4.97 × 10−7; (8) padjust = 1.75 × 10−2. c, d Data are presented as combined violin and box plots (thick line in the box corresponds to median; lower and upper edges of the box indicating the first (Q1) and third (Q3) quartiles; whiskers extend to 1.5 times the IQR). Individual data points are presented using the jitter method. Kruskal-Wallis tests with Dunn posthoc tests (two-sided) and Benjamini-Hochberg corrections for multiple comparisons were used to test for statistical significance. *, padjust < 0.05; **, padjust < 0.01, and ***, padjust < 0.001. Source data are provided as a Source Data file.
Fig. 2
Fig. 2. Site-specific pattern of DNA copy number aberrations in CRC metastases based on the CRCTropism cohort.
a Organotropic map presenting CIs with site-specific enrichment (n = 191). All p-values were obtained by two-sided Fisher exact tests followed by Benjamini-Hochberg adjustment for multiple comparison (legend). The size of the bubbles encodes the frequency a given CI was observed in the cohort (legend). b Doughnut plots showing the fraction of metastases (n = 191) that harbor selected organotropic CIs (see legend for the assignment of secondary organs: li, liver; lu, lung; br, brain; chr., chromosomal arm; see also Supplementary Fig. 5 for a full representation of all organotropic CIs). The frequency of occurrence is color-encoded according to the legend shown on the right. Two-sided Fisher exact tests with Benjamini-Hochberg adjustment for multiple comparison were used (*, padjust < 0.05; **, padjust < 0.01, and ***, padjust < 0.001). (1) padjust = 3.80 × 10−2; (2) padjust = 1.14 × 10−2; (3) padjust = 2.48 × 10−2; (4) padjust = 3.80 ×  10−2; (5) padjust = 4.10 × 10−2; (6) padjust = 7.80 × 10−3; (7) padjust = 3.80 × 10−2; (8) padjust = 4.85 × 10⁻³; (9) padjust = 4.22 × 10⁻³; (10) padjust = 3.08 × 10⁻⁷. c Graphical summary of autosomal organotropic CIs with arbitrary intra-organ sites of lesions. CIs observed in more than 15% of the respective metastases are highlighted in bold. Source data are provided as a Source Data file.
Fig. 3
Fig. 3. Organotropic genetic signatures of metastatic CRC in the MetTropism cohort.
a Pattern of chromosomal arm aneuploidies in liver, lung, and brain metastases determined using ASCETS, with n = 792 metastases subjected to analysis. For each metastatic site, the frequency of the chromosomal arm aneuploidy (bottom, deletion; top, amplification) is color-coded as shown in the color scale at the right. b Profile of tumor mutational burden (TMB) and fraction genome altered (FGA) for each liver, lung, and brain metastasis (FGA: p = 8.23 × 10−9 [Kruskal-Wallis test], padjust = 4.66 × 10−9 for brain metastases vs. liver and padjust = 5.50 × 10−9 for brain metastases vs. lung metastases [Dunn posthoc test with Benjamini-Hochberg correction]; TMB: p = 0.113 [Kruskal-Wallis test]; n = 792). c Organotropic map of gene-level gains and losses derived from GISTIC 2.0 (n = 792). Significant CIs are indicated in blue, with the event frequency represented by the bubble size (legend). The doughnut plot in the top right shows the fraction of metastases with +12p as determined using ASCETS (n = 758), where the occurrence frequency is color-encoded according to the legend on the right. (1) padjust = 5.19 × 10−3. d Co-occurrence probability mapping of genetic changes observed in CRC metastases (n = 792), with red shades indicating significant positive associations and blue shades depicting significant negative associations, based on co-occurrence modeling (two-sided), followed by Benjamini-Hochberg adjustment. The inset presents close-ups of selected genetic changes (amp, amplification; del, deletion; mut, mutation). e Fraction of metastases (n = 792) harboring KRAS amplifications determined using GISTIC 2.0 (color-coded according to the legend). (1) padjust = 3.49 × 10−3. f Bar plot depicting the frequency of KRAS amplifications among metastases (n = 352) with oncogenic KRAS mutations. (1) padjust = 0.019; (2) padjust = 0.019. c, e, f Adjusted p-values were obtained by two-sided Fisher exact test with Benjamini-Hochberg adjustment for multiple comparisons. *, padjust < 0.05; **, padjust < 0.01. Source data are provided as a Source Data file.
Fig. 4
Fig. 4. Rewiring of KRAS mutated and amplified CRCs as indicated by the TCGA cohort.
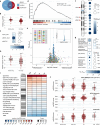
a Venn diagram showing the relationship between CRCs with KRAS mutations (blue circle) and amplifications (red circles). b Box plot of normalized KRAS expression levels, with p-values from two-sided Wilcoxon rank-sum test and Benjamini-Hochberg adjustment for multiple comparison (n = 64 and n = 133 for CRC with KRAS mutation and amplification and CRC with KRAS mutation, respectively). (1) padjust = 1.32 × 10−3. c Multiple linear regression indicating KRAS_CNV as a significant predictor of phosphorylated MAP2K1/2, along with pBRAF_S445, and pMAP2K1 with similar variable importance scores (ScoreVI), with n = 160. d. Two-sided GSEA using the M2900 gene set, derived from cells overexpressing oncogenic KRAS. The normalized enrichment score (NES), nominal p-value and false discovery rate (FDR)-adjusted p-value are shown (n = 197). e Volcano plot of differential gene expression, colored by chromosomal arm (see legend). The inset highlights genes on chromosome 12. Statistical significance was assessed using two-sided Wilcoxon rank-sum tests with Benjamini-Hochberg correction for multiple comparisons (n = 197). The horizontal dashed line indicates padjust = 0.05, while vertical dashed lines correspond to a 1.25-fold change. f Two-sided GSEA using C1 positional gene sets on chromosomal bands enriched in KRAS mutated and amplified CRCs vs. CRC with KRAS mutation (n = 197); circle size indicates NES and color the FDR-adjusted p-value. An ideogram of chromosome 12 is provided for orientation. g Enrichr analysis of upregulated genes in CRCs with KRAS mutation and amplification vs. CRC with KRAS mutation (n = 197), using enriched genes on chromosome 12 and other chromosomes. Circle size reflects the Enrichr score and color indicates the Benjamini-Hochberg-adjusted p-value. The Gene Ontology and MSigDB Hallmark genes sets were tested. h. Winter hypoxia score comparison using two-sided Wilcoxon rank-sum test (n = 45 and n = 106 for CRC with KRAS mutation and amplification and CRC with KRAS mutation, respectively; (1) padjust = 8.75 × 10−4). i Heatmap of median ssGSEA scores using KEGG_MEDICUS gene sets, with Benjamini-Hochberg adjusted p-values from Kruskal-Wallis tests encoded in grayscale (n = 412). m&a, KRAS mutated and amplified CRCs; mut, KRAS mutated CRCs; wt, KRAS wildtype CRCs; del, KRAS deletion CRCs (without KRAS mutation). j Box plots of ssGSEA scores for selected gene sets, analyzed by Kruskal-Wallis tests with Dunn posthoc test (two-sided) and Benjamini-Hochberg adjustment (n = 64 for KRAS mutated and amplified CRCs; n = 133 for KRAS mutated CRCs; n = 181 for KRAS wildtype CRCs; n = 34 for KRAS deletion CRCs (without KRAS mutation); (1) padjust = 6.78 × 10−3; (2) padjust = 1.69 × 10−3; (3) padjust = 1.59 × 10−7; (4) padjust = 6.19 × 10−4; (5) padjust = 5.27 × 10−4; (6) padjust = 3.20 × 10−6; (7) padjust = 3.12 × 10−2; (8) padjust = 7.63 × 10−3; (9) padjust = 1.17 × 10−3). Analyses compare CRCs with KRAS mutation and amplification to those with KRAS mutation alone (b, dh) as well as to wildtype CRC and CRC with KRAS deletions without KRAS mutation (i, j). (b, h, j) Data are presented with individual data points and a box-and-whisker-plot (thick line, median; box edges, Q1/Q3; whiskers, 1.5 ×  IQR). *, padjust < 0.05; **, padjust < 0.01, and ***, padjust < 0.001. Source data are provided as a Source Data file.
Fig. 5
Fig. 5. Transcriptional profile of CRCs with deletions of MLH1 and BRCA1 in the TCGA cohort.
a Volcano plot showing differential gene expression between MLH1 deletion CRC and MLH1 control CRCs, with genes colored by chromosomal arm (inset highlights genes on chromosome 3; horizontal dashed line, padjust = 0.05; vertical dashed lines, 1.25-fold change). Significance was determined by two-sided Wilcoxon rank-sum tests with Benjamini-Hochberg adjustment (n = 276). b Two-sided GSEA using C1 positional gene sets indicating that genes encoded on chromosomal arm 3p (ideogram on the left) are significantly downregulated in CRC with MLH1 deletion compared to MLH1 control CRCs (n = 276). Circle size represents NES, color indicates FDR-adjusted p-value. c G:profiler analysis of genes upregulated in MLH1 deletion CRCs, categorized by Gene Ontology (GO), including molecular function (MF), biological process (BP), and cellular component (CC) (n = 276). P-values are adjusted using the g:SCS method. d Differential gene expression of the HOXA and HOXD loci and flanking genes, with circle size based on log2(fold change) and color reflecting Benjamini-Hochberg-adjusted p-values from two-sided Wilcoxon rank-sum tests (open circles indicate padjust > 0.05; n = 276). e CNV analysis of the HOXA and HOXD loci (two-sided Fisher exact test with Benjamini-Hochberg correction; n.s. not significant, (1) padjust = 0.757; (2) padjust = 0.941; n = 276)). f Volcano plot visualizing differential gene expression for BRCA1 deletion CRC vs. BRCA1 control CRC (n = 213). Inset shows genes on chromosome 17. Significance determined by two-sided Wilcoxon rank-sum tests with Benjamini-Hochberg adjustment. g Two-sided GSEA using C1 positional gene sets for chromosome 17 (ideogram) reveals that genes encoded on 17q are significantly downregulated in CRCs with BRCA1 deletion compared to BRCA1 control CRC (n = 213). Circle size represents NES, color indicates FDR-adjusted p-value. h G:profiler analysis of genes upregulated in BRCA1 deletion CRCs compared to BRCA1 control CRC (n = 213) with GO, KEGG (Kyoto Encyclopedia of Genes and Genomes), and Reactome (REAC) pathways (p-values adjusted by g:SCS method). i Differential gene expression of the HOXA locus and surrounding genes, with the top showing upregulated genes in BRCA1 deletion CRCs and the bottom showing downregulated ones; circle size reflects log2(fold change), while color indicates Benjamini-Hochberg-adjusted p-values from two-sided Wilcoxon rank-sum test (open circles denote padjust > 0.05; n = 213). Panels a–e compare CRCs with MLH1 deletion to control CRCs, while (f–i) compare CRCs with BRCA1 deletion to control CRCs. Source data are provided as a Source Data file.
Fig. 6
Fig. 6. Oncogenetic tree models of metastatic CRC based on maximum likelihood estimation.
Analyses were done using the CRCTropism cohort for the following metastasis sites: a. liver (n = 98), b. lung (n = 69), and c. brain (n = 33). CIs were classified into nine categories from early to late according to proximity to the root (gray boxes). Organotropic events are marked by asterisks. Source data are provided as a Source Data file.
Fig. 7
Fig. 7. Reconstruction of phylogenetic trees using multi-sample cytogenetic data from individual CRC patients of the CRCTropism cohort.
ah The clinical course (top) and the reconstructed phylogenetic tree (bottom) are shown, with the tree scaled according to the number of CIs. Maximum parsimony was used for tree inference. CI events are colored based on the classification introduced in Fig. 6. If a particular event could not be uniquely linked (indicated by brackets), it is displayed at the earliest suggested occurrence. High-level amplifications are indicated in bold. The site of the primary tumor (p) and metastases (m, metachronous metastasis; s, synchronous metastasis) is also listed. Dx, diagnosis of primary cancer; Met, metastasis. Source data are provided as a Source Data file.

References

    1. Global Burden of Disease Cancer Collaboration. et al. Global, Regional, and National Cancer Incidence, Mortality, Years of Life Lost, Years Lived With Disability, and Disability-Adjusted Life-Years for 29 Cancer Groups, 1990 to 2017: A Systematic Analysis for the Global Burden of Disease Study.JAMA Oncol5, 1749–1768 (2019). - PMC - PubMed
    1. Chaffer, C. L. & Weinberg, R. A. A perspective on cancer cell metastasis. Science331, 1559–1564 (2011). - PubMed
    1. Brouwer, N. P. M. et al. An overview of 25 years of incidence, treatment and outcome of colorectal cancer patients. Int J. Cancer143, 2758–2766 (2018). - PMC - PubMed
    1. Elferink, M. A., de Jong, K. P., Klaase, J. M., Siemerink, E. J. & de Wilt, J. H. Metachronous metastases from colorectal cancer: a population-based study in North-East Netherlands. Int J. Colorectal Dis.30, 205–212 (2015). - PubMed
    1. Hu, Z. et al. Quantitative evidence for early metastatic seeding in colorectal cancer. Nat. Genet51, 1113–1122 (2019). - PMC - PubMed

MeSH terms