

Explainable artificial intelligence to diagnose early Parkinson's disease via voice analysis
- PMID: 40188263
- PMCID: PMC11972358
- DOI: 10.1038/s41598-025-96575-6
Explainable artificial intelligence to diagnose early Parkinson's disease via voice analysis
Abstract
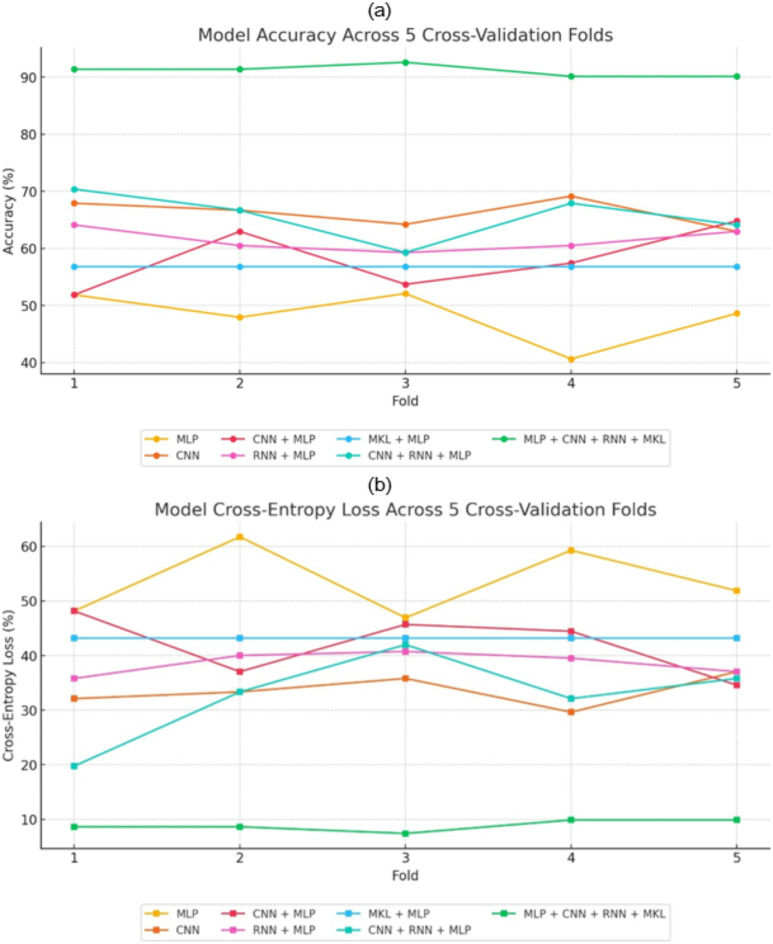
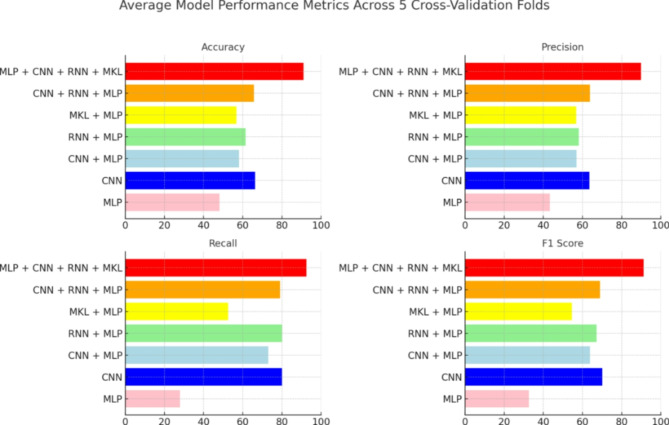
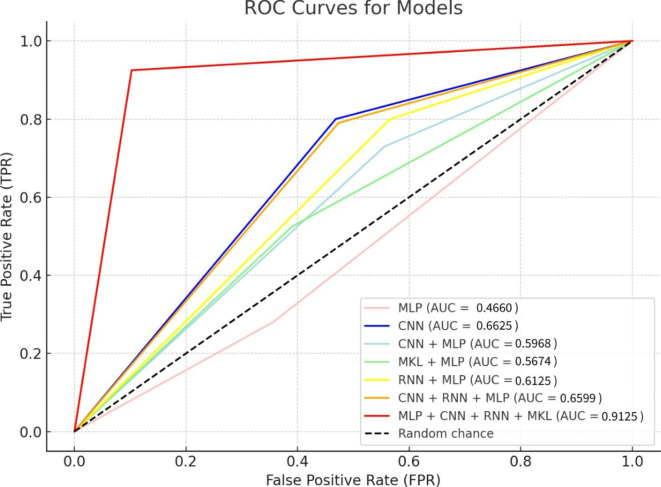
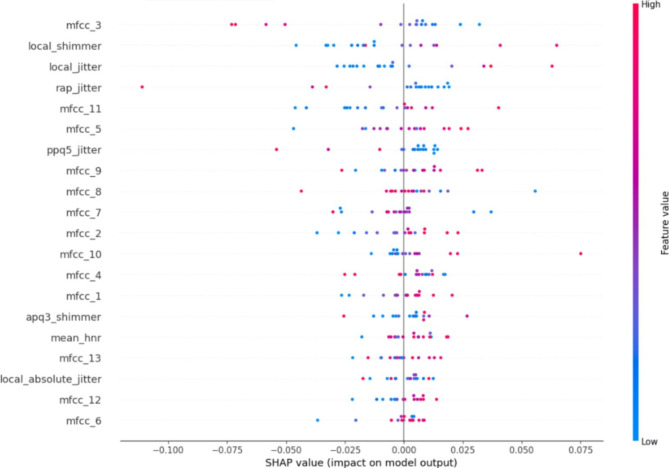
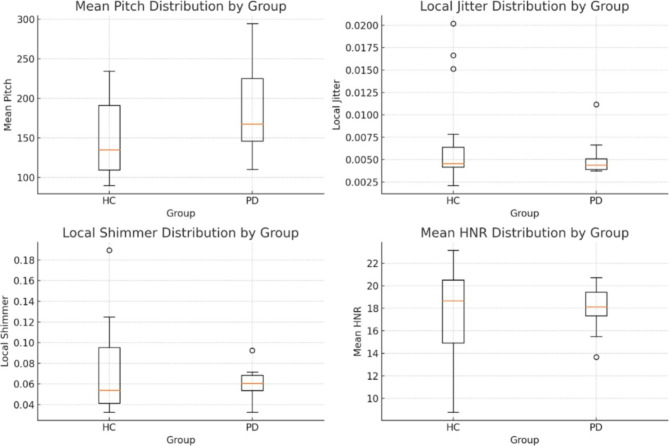
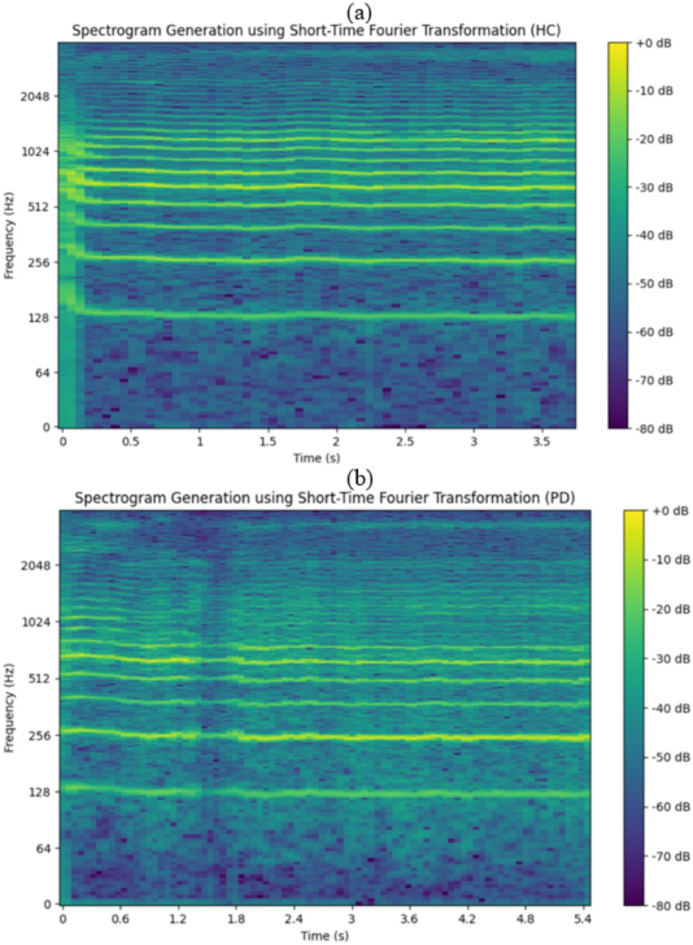
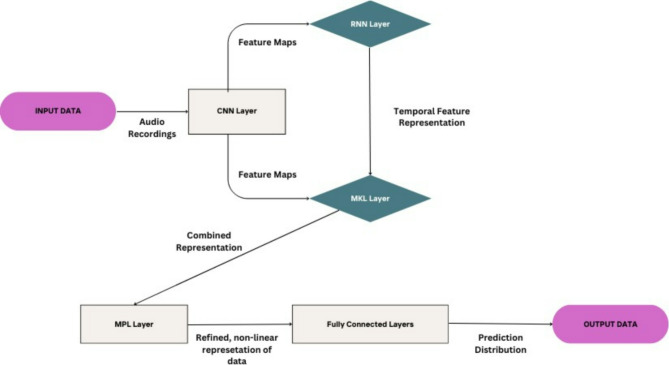
Parkinson's disease (PD) is a neurodegenerative disorder affecting motor control, leading to symptoms such as tremors and stiffness. Early diagnosis is essential for effective treatment, but traditional methods are often time-consuming and expensive. This study leverages Artificial Intelligence (AI) and Machine Learning (ML) techniques, using voice analysis to detect early signs of PD. We applied a hybrid model combining Convolutional Neural Networks (CNN), Recurrent Neural Networks (RNN), Multiple Kernel Learning (MKL), and Multilayer Perceptron (MLP) to a dataset of 81 voice recordings. Acoustic features such as Mel-Frequency Cepstral Coefficients (MFCCs), jitter, and shimmer were analyzed. The model achieved 91.11% accuracy, 92.50% recall, 89.84% precision, 91.13% F1 score, and an area-under-the-curve (AUC) of 0.9125. SHapley Additive exPlanations (SHAP) provided data explainability, identifying key features driving the PD diagnosis, thus enhancing AI interpretability and trustability. Furthermore, a probability-based scoring system was developed to enable PD patients and clinicians to track disease progression. This AI-driven approach offers a non-invasive, cost-effective, and rapid tool for early PD detection, facilitating personalized treatment through vocal biomarkers.
Keywords: Deep learning; Explainable AI; Parkinson’s disease; Vocal biomarkers.
© 2025. The Author(s).
Conflict of interest statement
Declarations. Competing interests: The authors declare no competing interests.
Figures
Similar articles
-
Analysis of Voice, Speech, and Language Biomarkers of Parkinson's Disease Collected in a Mixed Reality Setting.Sensors (Basel). 2025 Apr 10;25(8):2405. doi: 10.3390/s25082405. Sensors (Basel). 2025. PMID: 40285095 Free PMC article.
-
Artificial intelligence in Parkinson's disease: Early detection and diagnostic advancements.Ageing Res Rev. 2024 Aug;99:102410. doi: 10.1016/j.arr.2024.102410. Epub 2024 Jul 5. Ageing Res Rev. 2024. PMID: 38972602 Review.
-
Non-invasive detection of Parkinson's disease based on speech analysis and interpretable machine learning.Front Aging Neurosci. 2025 Apr 30;17:1586273. doi: 10.3389/fnagi.2025.1586273. eCollection 2025. Front Aging Neurosci. 2025. PMID: 40370753 Free PMC article.
-
Diagnosis of Parkinson's disease based on voice signals using SHAP and hard voting ensemble method.Comput Methods Biomech Biomed Engin. 2024 Oct;27(13):1858-1874. doi: 10.1080/10255842.2023.2263125. Epub 2023 Sep 28. Comput Methods Biomech Biomed Engin. 2024. PMID: 37771234
-
The role of AI and machine learning in the diagnosis of Parkinson's disease and atypical parkinsonisms.Parkinsonism Relat Disord. 2024 Sep;126:106986. doi: 10.1016/j.parkreldis.2024.106986. Epub 2024 May 3. Parkinsonism Relat Disord. 2024. PMID: 38724317 Review.
Cited by
-
Harnessing artificial intelligence for brain disease: advances in diagnosis, drug discovery, and closed-loop therapeutics.Front Neurol. 2025 Jul 28;16:1615523. doi: 10.3389/fneur.2025.1615523. eCollection 2025. Front Neurol. 2025. PMID: 40791911 Free PMC article. Review.
References
-
- Tsanas, A. et al. Accurate telemonitoring of Parkinson’s disease progression by noninvasive speech tests. IEEE Trans. Biomed. Eng.57, 884–893. 10.1109/TBME.2009.2036000 (2010). - PubMed
-
- Alhanai, T., Au, R. & Glass, J. Detecting depression with audio/text sequence modeling of interviews. Interspeech 1716–1720. 10.21437/Interspeech.2018-2522 (2018).
-
- Alissa, M. et al. Parkinson’s disease diagnosis using convolutional neural networks and figure-copying tasks. Neural Comput. Appl.34, 1433–1453. 10.1007/s00521-021-06469-7 (2022).
MeSH terms
LinkOut - more resources
Full Text Sources
Medical
