. 2025 Apr 22;44(4):115530.
doi: 10.1016/j.celrep.2025.115530. Epub 2025 Apr 5.

A single amino acid in the Salmonella effector SarA/SteE triggers supraphysiological activation of STAT3 for anti-inflammatory gene expression

Affiliations

A single amino acid in the Salmonella effector SarA/SteE triggers supraphysiological activation of STAT3 for anti-inflammatory gene expression

Margaret R Gaggioli et al. Cell Rep. .

Abstract

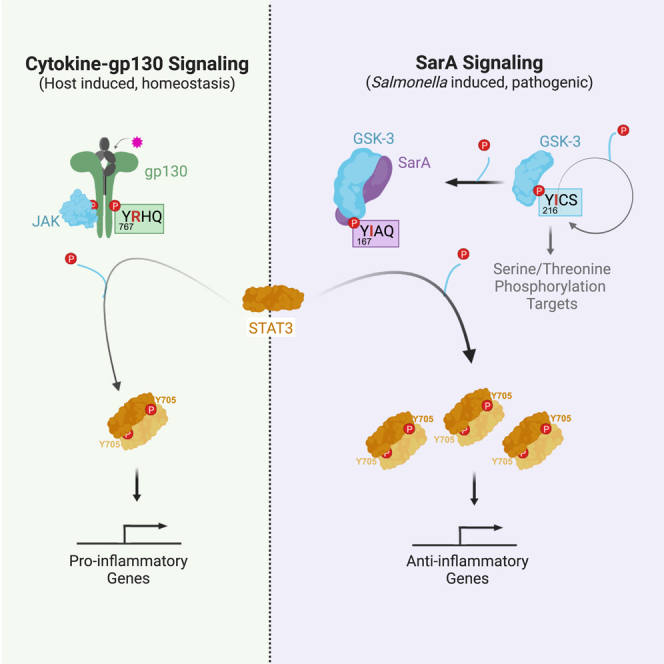
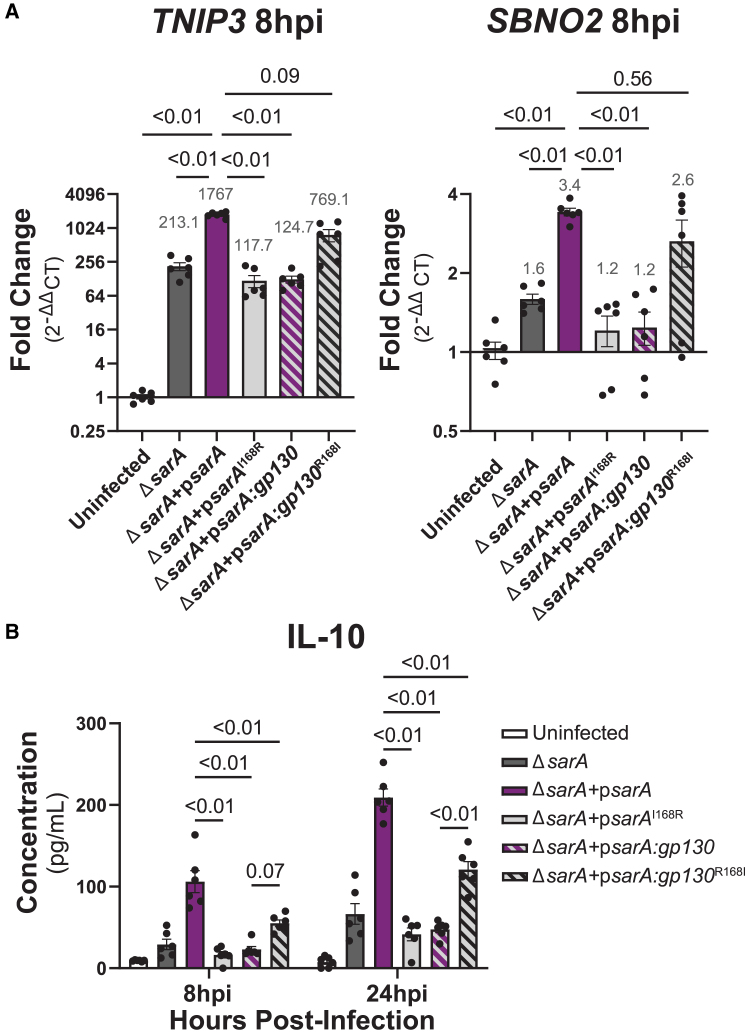
Salmonella causes ∼1 million cases of gastroenteritis annually in the United States. Critical to virulence are secreted effectors that reprogram host functions. We previously discovered the effector SarA facilitates phosphorylation of STAT3, inducing expression of the anti-inflammatory cytokine interleukin-10 (IL-10). This STAT3 activation requires a region of homology with the host cytokine receptor gp130. Here, we demonstrate that a single amino acid difference is critical for the anti-inflammatory bias of SarA-STAT3 signaling. An isoleucine at pY+1 of the YxxQ motif in SarA (which binds the STAT3 SH2 domain) causes increased STAT3 recruitment and phosphorylation, biasing toward anti-inflammatory targets. This isoleucine renders SarA a better substrate for tyrosine phosphorylation by GSK-3. GSK-3 is canonically a serine/threonine kinase that nonetheless undergoes tyrosine autophosphorylation at a motif with isoleucine at the pY+1 position. Our results provide a molecular basis for how a Salmonella effector achieves supraphysiological levels of STAT3 activation to control host genes.

Keywords: CP: Immunology; CP: Microbiology; GSK-3; IL-10; IL-6; IL6ST; JAK-STAT; SOCS3; STM2585; Y705; adaptation; gogC.


Conflict of interest statement

Declaration of interests The authors declare no competing interests.

Figures

None
Graphical abstract
Figure 1
Figure 1
SarA induces anti-inflammatory cell signaling and strong STAT3 phosphorylation (A) Graphical comparison of SarA vs. gp130 activation of STAT3, including sequence alignment of SarA and gp130 GBS domain. Schematic created using BioRender. (B) SarA upregulated genes significantly overlap with IL-10 target genes. Venn diagrams showing overlap of genes upregulated in a SarA-dependent manner (at 24 h post-Salmonella Typhimurium infection in LCLs [data from Jaslow et al.5]) and in an IL-10- or IL-6-dependent manner (after 8 h cytokine stimulation in dendritic cells [data from Braun et al.10]). p values obtained from a chi-squared test. See also Figure S1. (C) Wild-type Salmonella Typhimurium infection leads to increased expression of anti-inflammatory genes. THP-1 cells were either stimulated with 10 ng/mL of IL-6 or infected with wild type or ΔsarA Salmonella Typhimurium. RNA was collected from cells 8 hpi, and expression levels of SBNO2 and TNIP3 were measured via qPCR. Points represent six biological replicates across three experiments (with each biological replicate shown being the average of three qPCR technical replicates). Gray values above bars are the mean. Data are represented as mean ± SEM. p values obtained from Brown-Forsythe and Welch ANOVAs with Dunnett’s T3 multiple comparisons test. (D) ΔsarA mutant strain of Salmonella Typhimurium has a significantly higher percentage of infection at 8 hpi, but wild type and ΔsarA have similar rates of intracellular replication. THP-1 cells were infected at MOI 10 with inducible GFP-expression bacteria. Bacterial replication was quantified as the ratio of median GFP value of infected cells at 8 hpi over 3.5 hpi. Points represent six biological replicates across three independent experiments. Data are represented as mean ± SEM. p values obtained from unpaired t tests with Welch’s correction. (E) SarA GBS domain leads to greater STAT3 phosphorylation and SOCS3 abundance compared to gp130 GBS domain as quantified by western blot after overexpression in HeLa cells. The asterisk on the β-tubulin blot marks the residual signal from the ∼50-kDa FLAG band of FLAG-gp130; they are similar molecular weights, and both were detected using anti-mouse secondary antibody. Representative of four experiments that are quantified in (F) and (G). See also Figure S3. (F) Quantification of STAT3 phosphorylation at each time point from western blot in (E). Points represent four experiments. Data are represented as mean ± SEM. p values obtained from unpaired t tests with Welch’s correction comparing FLAG-SarA to FLAG-SarA:gp130 and FLAG-gp130 to FLAG-gp130:SarA. (G) Quantification of SOCS3 abundance at each time point from western blot in (E). Points represent four experiments. Data are represented as mean ± SEM. p values obtained from unpaired t tests, with Welch’s correction comparing FLAG-SarA to FLAG-SarA:gp130 and FLAG-gp130 to FLAG-gp130:SarA. (H) SarA GBS domain leads to greater STAT3 phosphorylation and SOCS3 abundance compared to gp130 GBS domain as quantified by western blot after Salmonella Typhimurium infection in THP-1 cells. Representative of four experiments that are quantified in (I) and (J). See also Figures S2 and S4. (I) Quantification of STAT3 phosphorylation at each time point from western blot in (H). Points represent four experiments. Data are represented as mean ± SEM. p values obtained from a two-way ANOVA with Tukey’s multiple comparisons test. (J) Quantification of SOCS3 abundance at each time point from western blot in (H). Points represent four experiments. Data are represented as mean ± SEM. p values obtained from a two-way ANOVA with Tukey’s multiple comparisons test.
Figure 2
Figure 2
Lack of SOCS3/SHP-2 binding does not explain supraphysiological activation of STAT3 by SarA Knockdown of SOCS3 and SHP-2 do not significantly increase SarA-induced STAT3 phosphorylation. HeLa cells were treated with either a non-targeting control (siGenome non-targeting #5), siSOCS3, or siSHP-2 48 h before stimulation with 10 ng/mL of human OSM or infection with either a wild-type-complemented or psarA:gp130-complemented strain of Salmonella Typhimurium. Cell lysates were collected at 24 hpi. STAT3 phosphorylation measured by western blot shows that knocking down negative regulators SOCS3 and SHP-2 was not able to restore psarA:gp130-induced activation to wild-type levels. Data are from five experiments and represented as mean ± SEM. p values obtained from a two-way ANOVA with a Dunnett’s multiple comparisons test. See also Figure S5.
Figure 3
Figure 3
Isoleucine at pY+1 position leads to increased STAT3 binding and phosphorylation (A) Table of mutations made to YxxQ STAT3 binding motif in FLAG-SarA and FLAG-SarA:gp130 constructs. (B) Effects of mutants on STAT3 phosphorylation. Constructs in (A) were overexpressed in HeLa cells. STAT3 phosphorylation measured 24 h post-transfection by western blot shows that mutating the pY+1 position in SarA from isoleucine to arginine leads to a significant decrease in STAT3 activation. Mutating the same position in SarA:gp130 from arginine to isoleucine restores STAT3 phosphorylation to wild-type levels. Mutating the pY+2 position has no significant effect. Data are from three experiments and represented as mean ± SEM. p values are from a one-way ANOVA with Dunnett’s multiple comparisons tests comparing all constructs to FLAG-SarA. (C) Isoleucine at the pY+1 position leads to greater STAT3 phosphorylation during infection. THP-1 cells were infected with wild-type-, psarAI168R-, psarA:gp130-, or psarA:gp130R168I-complemented Salmonella Typhimurium. STAT3 phosphorylation was measured by western blot. Data are from three experiments and represented as mean ± SEM. p values are from a two-way ANOVA with Tukey’s multiple comparisons test. See also Figure S6. (D) FLAG-SarA constructs with arginine at pY+1 position bind less STAT3. FLAG-SarA, FLAG-SarAI168R, FLAG-SarA:gp130, and FLAG-SarA:gp130R168I were overexpressed in HeLa cells for 24 h, followed by co-immunoprecipitation (coIP) and probing for bound STAT3 via western blot. Data are representative of three experiments. (E) Mutating the pY+1 position has a minimal effect on STAT3 binding. Purified STAT3 was incubated with 25 μM phosphopeptides, and a thermal shift assay was used to calculate the melting temperature of the bound peptides as a proxy for binding affinity. Mutating the pY+1 position did not significantly affect melting temperature. Data are from three independent experiments (three technical replicates per experiment were averaged together) and represented as mean ± SEM. p values are from Brown-Forsythe and Welch ANOVAs tests with Dunnett’s T3 multiple comparisons test.
Figure 4
Figure 4
Isoleucine at the pY+1 position makes SarA a better substrate for GSK-3, but it has no effect on gp130 (A) Isoleucine at the pY+1 position is required for SarA phosphorylation. Empty vector and panel of FLAG-SarA constructs were overexpressed in HeLa cells, and coIP confirms that while GSK-3 is bound to all constructs, tyrosine phosphorylation of SarAI168R and SarA:gp130 was not detected. Data are representative of three experiments. (B) IP-MS results show how pY+1 mutation affects abundance of proteins bound to each SarA construct. Data from one IP-MS experiment confirming IP-western results in (A). See also Figure S7. (C) Mutation of isoleucine at the pY+1 position greatly reduces phosphorylation of SarA by GSK-3. GFP, GFP-SarAΔN44, and GFP-SarAΔN44I168R were expressed in GSK-3α/β−/− 293ET cells, immunoprecipitated, and assessed for their ability to be tyrosine phosphorylated by GSK-3β in an in vitro kinase assay containing 1 mM ATP with or without recombinant Avi-GSK-3βS9A (0.2 μM) and His6-STAT3127-715 (0.2 μM). Data are representative of three experiments. (D) Isoleucine at the pY+1 position is not sufficient to induce greater levels of gp130-mediated STAT3 phosphorylation. Empty vector, FLAG-gp130, FLAG-gp130:sarA, and FLAG-gp130R238I were overexpressed in HeLa cells for 24 h, STAT3 phosphorylation assessed by western blot shows that the R238I single-point mutation does not increase pSTAT3 levels compared to wild-type gp130. Data are from four experiments and represented as mean ± SEM. p values obtained from Brown-Forsythe and Welch ANOVAs with Dunnett’s T3 multiple comparisons test.
Figure 5
Figure 5
Isoleucine at pY+1 position promotes anti-inflammatory signaling bias (A) Arginine in the pY+1 position leads to decreased expression of anti-inflammatory genes during infection, and isoleucine at this position rescues the expression of these genes. THP-1 cells were infected with ΔsarA, wild-type-complemented, psarAI168R, psarA:gp130, or psarA:gp130R168ISalmonella Typhimurium. RNA was collected from cells 8 hpi and expression levels of SBNO2 and TNIP3 were measured via qPCR. Data points are from six biological replicates across three experiments (with each biological replicate shown being the average of three qPCR technical replicates). Gray values above bars are the mean. Data are represented as mean ± SEM. p values obtained from Brown-Forsythe and Welch ANOVAs with Dunnett’s T3 multiple comparisons test. (B) Arginine in the pY+1 position leads to decreased production of IL-10 during infection and is rescued with isoleucine at the position. THP-1 cells were infected with ΔsarA, wild-type-complemented, psarAI168R, psarA:gp130, or psarA:gp130R168ISalmonella Typhimurium. Cell supernatant was collected at 8 and 24 hpi, and IL-10 was measured via ELISA. Data are from six biological replicates across three experiments and represented as mean ± SEM. p values obtained from a two-way ANOVA with Sidak’s multiple comparisons test.
Figure 6
Figure 6
SarA is variably present in Salmonella serovars, but isoleucine at pY+1 position is always conserved (A) SarA is present in diverse S. enterica subspecies and serovars. Mean E-values (indicated by color) from BLASTp of SarA in 21,223 Salmonella isolates were merged with an existing whole-genome maximum-likelihood phylogeny. Serovars without corresponding BLASTp data are in gray. (B) Isoleucine at pY+1 is invariable across Salmonella isolates that contain SarA and homologs of the human protein GSK-3β. Sequence logos were derived from multiple sequence alignments and reflect the relative frequency of each residue across all aligned sequences. The YxxQ motif that is homologous between SarA and IL6ST is highlighted, as is the known autophosphorylation site in the kinase GSK-3β. Known chemical classification of each residue is indicated by color.

Update of

References

    1. Hoffmann S., Maculloch B., Batz M. Economic Burden of Major Foodborne Illnesses Acquired in the United States, EIB-140. U.S. Department of Agriculture, Economic Research Service; 2015.
    1. Jimenez A., Chen D., Alto N.M. How Bacteria Subvert Animal Cell Structure and Function. Annu. Rev. Cell Dev. Biol. 2016;32:373–397. doi: 10.1146/annurev-cellbio-100814-125227. - DOI - PMC - PubMed
    1. Galán J.E., Collmer A. Type III Secretion Machines: Bacterial Devices for Protein Delivery into Host Cells. Science. 1999;284:1322–1328. - PubMed
    1. Jennings E., Thurston T.L.M., Holden D.W. Salmonella SPI-2 Type III Secretion System Effectors: Molecular Mechanisms And Physiological Consequences. Cell Host Microbe. 2017;22:217–231. doi: 10.1016/j.chom.2017.07.009. - DOI - PubMed
    1. Jaslow S.L., Gibbs K.D., Fricke W.F., Wang L., Pittman K.J., Mammel M.K., Thaden J.T., Fowler V.G., Jr., Hammer G.E., Elfenbein J.R., Ko D.C. Salmonella Activation of STAT3 Signaling by SarA Effector Promotes Intracellular Replication and Production of IL-10. Cell Rep. 2018;23:3525–3536. doi: 10.1016/j.celrep.2018.05.072. - DOI - PMC - PubMed

Substances

LinkOut - more resources