. 2025 Jul 1:621:217695.
doi: 10.1016/j.canlet.2025.217695. Epub 2025 Apr 4.

KAP1 promotes gastric adenocarcinoma progression by activating Hippo/YAP1 signaling via binding to HNRNPAB

Affiliations

KAP1 promotes gastric adenocarcinoma progression by activating Hippo/YAP1 signaling via binding to HNRNPAB

Shumei Song et al. Cancer Lett. .

Abstract

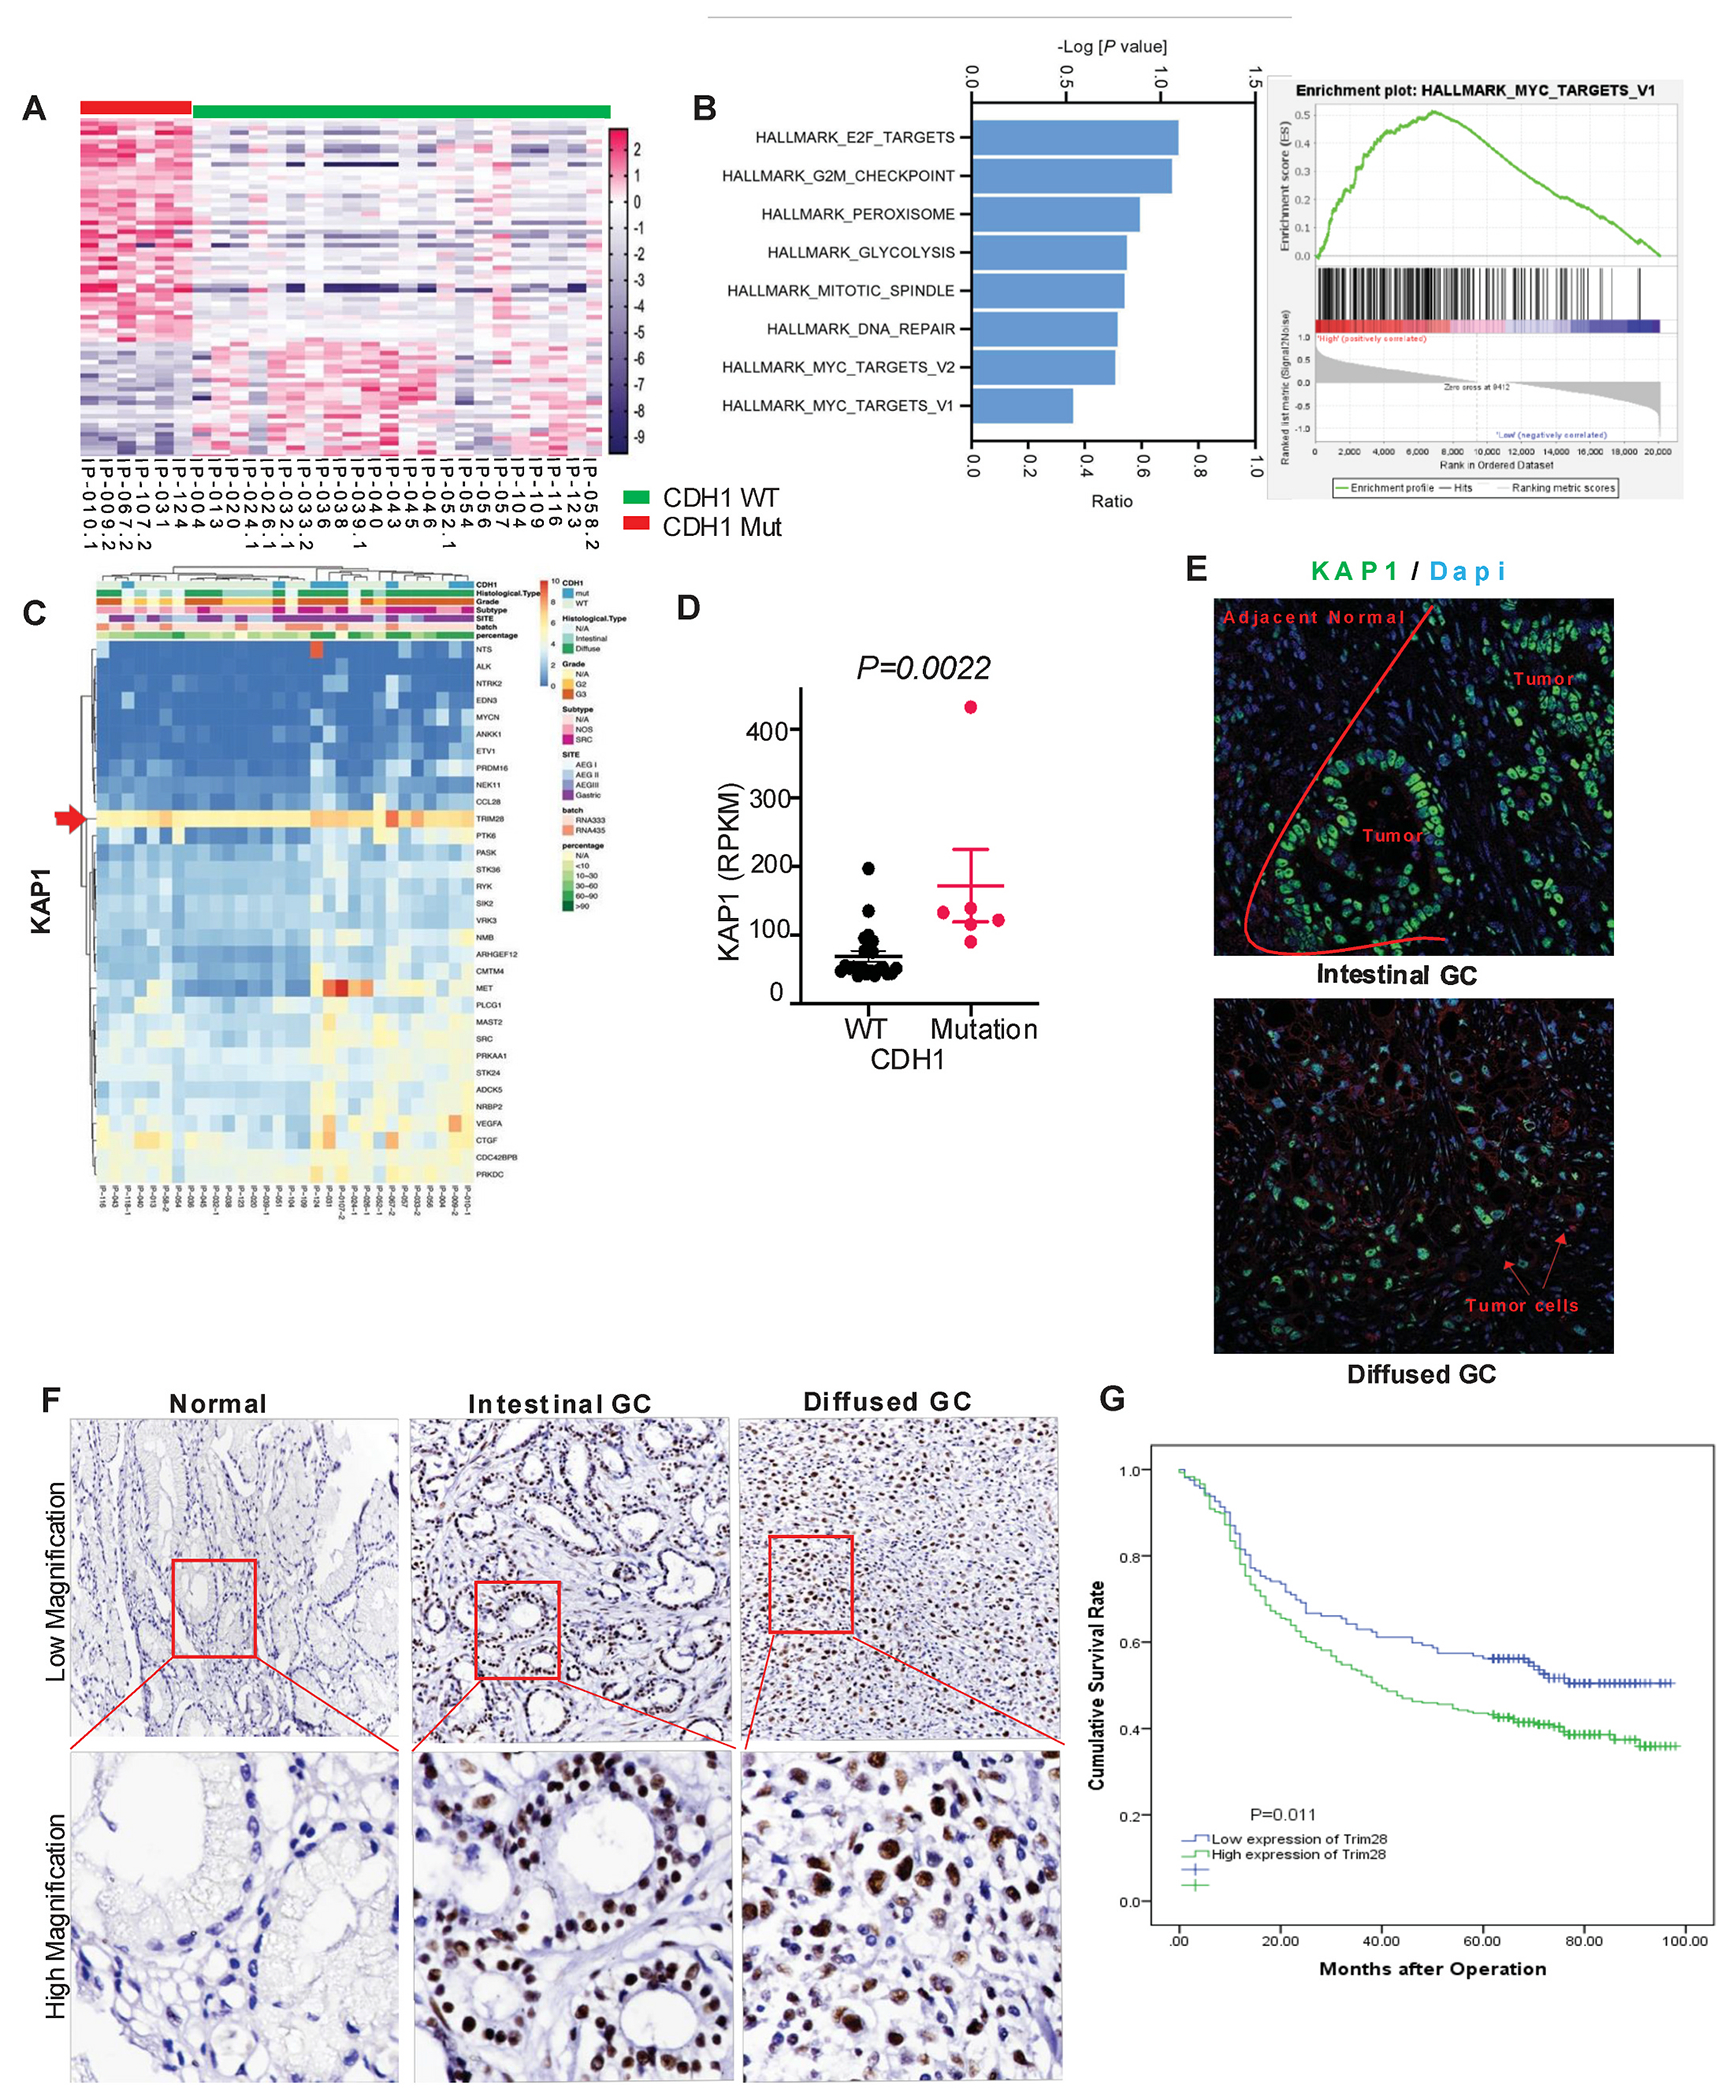
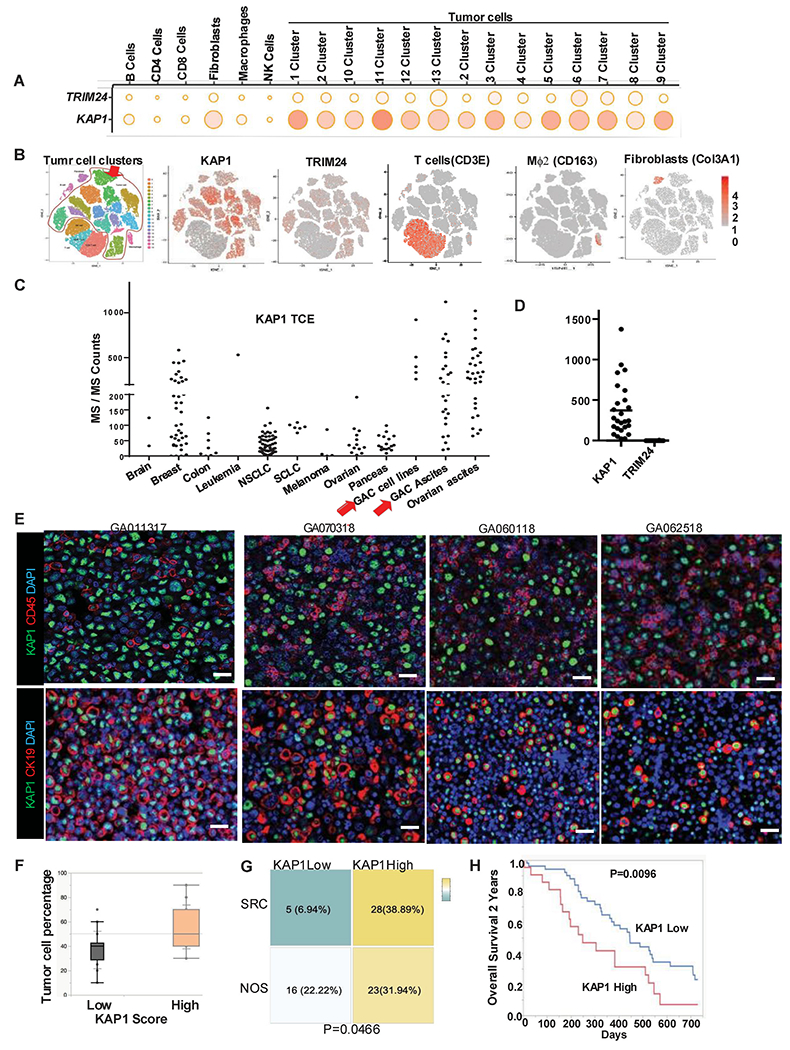
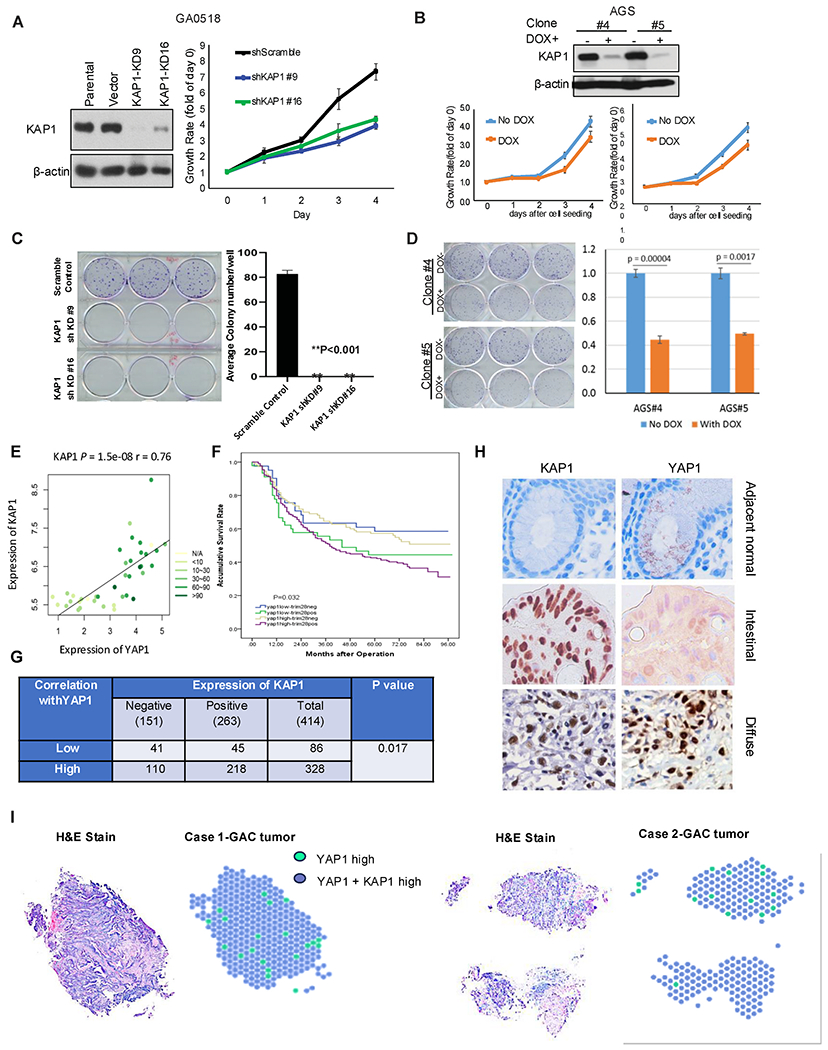
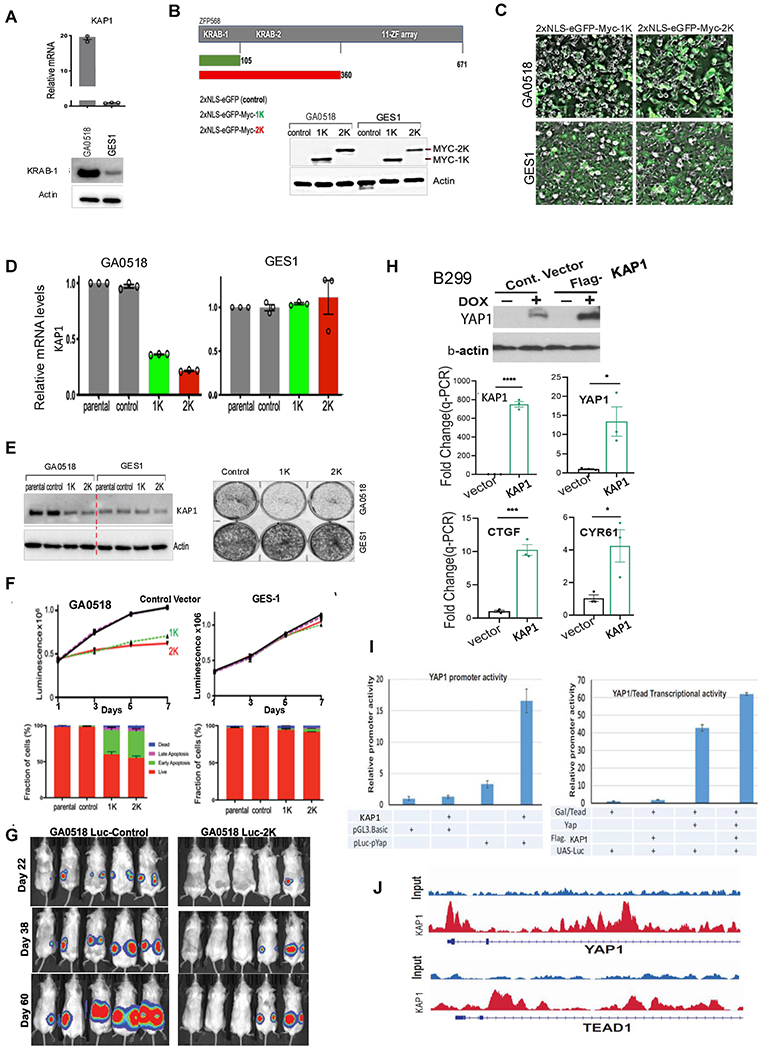
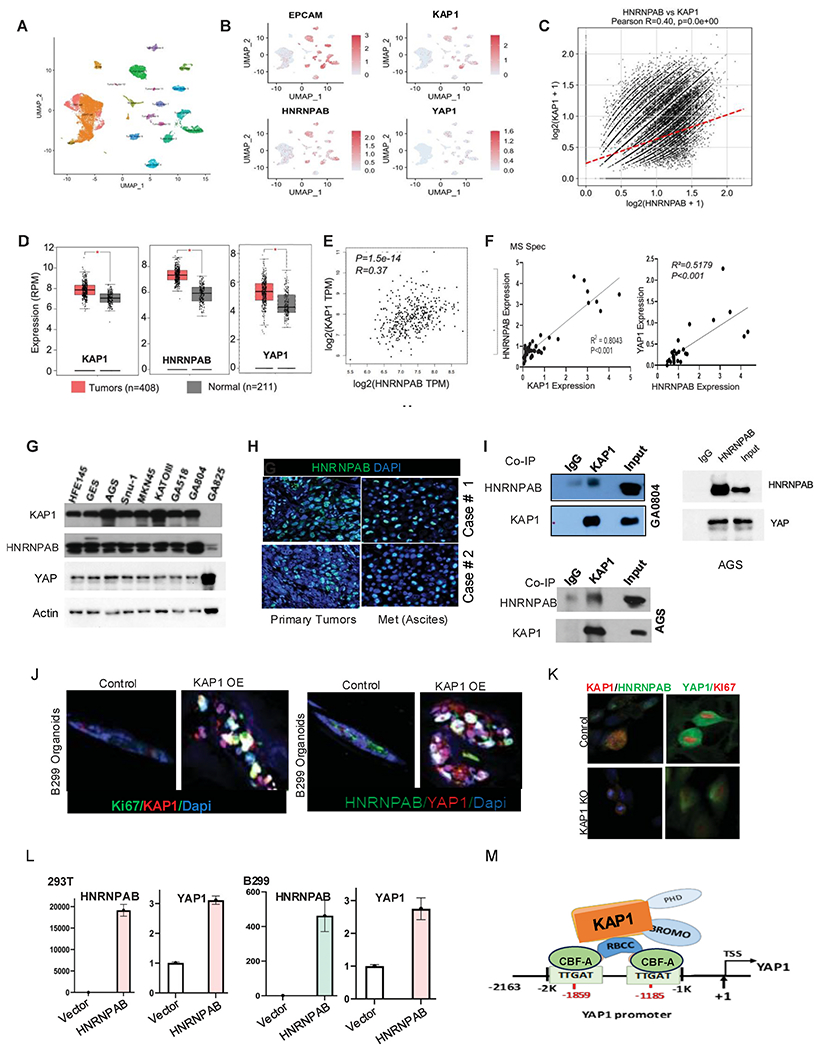
Gastric adenocarcinoma (GAC) remains a significant global health challenge, with over a million new cases annually. Peritoneal carcinomatosis (PC), detected in ∼20 % of cases at diagnosis and ∼45 % later, is uniformly fatal, with limited treatment options. This study investigated the role of KAP1 in GAC progression, focusing on its interaction with YAP1 and cancer stemness traits. Analysis of over 596 primary GACs and 72 PC samples revealed that high nuclear KAP1 expression correlates with poor prognosis. KAP1 knockdown reduced oncogenic activity and stemness traits in GAC cells. Mechanistically, KAP1 positively regulates YAP1 transcription by binding to its promoter and reducing H3K27ac levels. Mass spectrometry identified an interaction between KAP1 and HNRNPAB, further modulating YAP1 signaling. Expression of the KRAB domain of ZFP568 without its DNA-binding zinc fingers inhibited both KAP1 and YAP1 expression, significantly reducing colony formation and tumor growth in vivo. Additionally, emerging antisense oligonucleotides (ASOs) targeting KAP1 or YAP1 effectively suppressed mouse tumor progression. These findings establish KAP1 as a critical driver of tumor progression in GAC through YAP1 regulation and HNRNPAB interaction, highlighting its potential therapeutic target. This study advances our understanding and offers a preclinical framework to improve outcomes for GAC.

Keywords: Antisense oligonucleotides; CDH1; H3K27ac; Patient derived ascites; Single cell RNA sequencing.


Conflict of interest statement

Declaration of competing interest The authors declare that they have no known competing financial interests or personal relationships that could have appeared to influence the work reported in this paper.

Figures

Fig. 1.
Fig. 1.. KAP1 Expression and Its Clinical Implications in Gastric Cancer with CDH1 Mutations
(A) The top 100 genes identified from integrated supervised analysis of WES and bulk RNA-Seq data from PC samples, categorized according to CDH1 mutations. (B) Gene Set Enrichment Analysis (GSEA) showing that E2F targets, G2M checkpoint, glycolysis, mitotic spindle, and MYC targets pathways are enriched in tumors with CDH1 mutations. The right panel shows the enrichment plot for MYC targets. (C) Heatmap displaying upregulated genes in bulk RNA-Seq data of ascites PC cells across all PC specimens, with KAP1 highlighted by a red arrow. (D) Expression levels of KAP1 in CDH1 wild-type and CDH1 mutant groups from our bulk RNA-Seq data. (E) Immunofluorescence (IF) staining of KAP1 in intestinal GC and diffuse type GC. The red line in the left panel demarcates adjacent normal and tumor tissue in intestinal GC, and the red arrow indicates tumor cells in diffuse GC (F) Immunohistochemistry (IHC) staining of KAP1 in normal stomach tissue, intestinal gastric cancer (GC), and diffuse type gastric cancer in our gastric adenocarcinoma (GAC) cohort, which includes 596 tumor and 294 ajacent normal tissues. (G) Survival curve of the GAC cohort based on KAP1 expression levels.
Fig. 2.
Fig. 2.
KAP1 and TRIM24 Expression in Gastric Adenocarcinoma Ascites and Their Clinical Implications (A) Dot plot of KAP1 and TRIM24 expression from scRNA-seq data of 20 gastric adenocarcinoma (GAC) ascites peritoneal carcinomatosis (PC) specimens. Clusters 0 to 9 represent tumor cells. Dot size indicates the percentage of cells expressing the gene, while color intensity indicates the average expression level. (B) tSNE scatter plot of scRNA-seq data from 20 ascites PC specimens. The red line circles and the red arrow points to tumor cells. Feature plots show the expression of KAP1, TRIM24, CD3E, CD163, and Col3A1.(C) Identification of KAP1 by mass spectrometry (MS) across various cancer types, including brain cancer, breast cancer, colon cancer, leukemia, NSCLC, SCLC, melanoma, ovarian cancer, pancreatic cancer, GAC cell lines, GAC ascites, and ovarian ascites.(D) Enrichment of KAP1 and TRIM24 in GAC ascites PC specimens, shown as MS/MS counts.(E) Immunofluorescence (IF) staining of KAP1, CD45, and CK19 in 4 PC samples. The upper panel shows KAP1 (green), CD45 (red), and DAPI (blue) co-staining. The lower panel shows KAP1 (green), CK19 (red), and DAPI (blue) co-staining. Scale bar: 20 μm. (F) Percentage of tumor cells in KAP1 low and high expression groups in 72 PC samples. (G) Percentage of KAP1 low and high expression patients in signet ring cell (SRC) carcinoma and non-specific (NOS) in 72 PC samples. (H) Overall survival of GC patients over 2 years, stratified by KAP1 expression levels.
Fig. 3.
Fig. 3.
Functional Analysis of KAP1 Knockdown in Gastric Adenocarcinoma Cell Lines (A) KAP1 expression in parental, vector control, KAP1 knockdown clone 9 (KD9), and KAP1 knockdown clone 16 (KD16) GA0518 cells. The cell growth rate of shScramble, shKAP1 #9, and shKAP1 #16 is displayed in the left panel. (B) Doxycycline-inducible AGS cells were established to knock down KAP1. After doxycycline treatment, KAP1 was knocked down in AGS cells. Two clones were established: clone 4 and clone 5. The cell growth rate of clone 4 and clone 5 is displayed in the lower panel. (C) Bright field image (left) of the colony formation assay and relative quantification (right) of colonies in scramble control, KAP1 shKD #9, and KAP1 shKD #16 GA0518 cell groups. (D) Bright field image (left) of the colony formation assay and relative quantification (right) of colonies in doxycycline-inducible AGS clone 4 and clone 5 before and after doxycycline treatment. (E) Correlation between KAP1 and YAP1 expression in GAC patients. (F) Accumulative survival rate of GAC patients according to YAP1 and KAP1 expression levels. Four groups were generated: YAP1low-KAP1neg, YAP1low-KAP1pos, YAP1high-KAP1neg, and YAP1high-KAP1pos. (G) Quantification of patient distribution according to YAP1 and KAP1 status. (H) IHC staining of KAP1 and YAP1 in normal stomach tissue, intestinal GAC, and diffuse GAC. (I) KAP1 expression is spatially co-localized with YAP1 based on the spatial transcriptomic dataset of human GAC.
Fig. 4.
Fig. 4.
Characterization and Functional Analysis of KAP1 Expression in GAC (A) Endogenous KAP1 expression in GA0518, GES1 at mRNA and protein levels. (B) Schematic representation of mouse ZFP568 and two KRAB-containing fragments (1K and 2K) used for expression. MYC-1K and MYC-2K were overexpressed in GA0518 and GES1 cells. (C) Bright field images of GA0518-2xNLS-eGFP-Myc-1K, GA0518-2xNLS-eGFP-Myc-2K, GES1-2xNLS-eGFP-Myc-1K, and GES1-2xNLS-eGFP-Myc-2K cells. (D) mRNA expression of KAP1 in parental, control, 2xNLS-eGFP-Myc-1K (1K), and 2xNLS-eGFP-Myc-2K (2K) groups in GA0518 and GES1 cells, respectively. (E) Protein expression level of KAP1 in parental, control, 1K, and 2K groups in GA0518 and GES1 cells, respectively (left panel). Colony formation assay of control, 1K, and 2K groups in GA0518 and GES1 cells, respectively (right panel). (F) Luminescence level of control, 1K, and 2K groups in GA0518 and GES1 cells, respectively (upper panel). The fraction of cells in parental, control, 1K, and 2K groups in GA0518 and GES1 cells, respectively, via apoptosis assay. Blue: dead cells; purple: late apoptosis cells; green: early apoptosis cells; red: live cells. (G) GA0518 control and GA0518 luc-2K cells were subcutaneously injected into NOD-SCID mice. At days 22, 38, and 60, mice were imaged to check tumor fluorescence levels. (H) Doxycycline-inducible expression of control vector and Flag-KAP1 was overexpressed in B299 cells. The protein expression of YAP1 in control vector and Flag-KAP1 in B299 cells before and after doxycycline treatment (upper panel). mRNA expression of KAP1, YAP1, CTGF, and CYR61 in control vector and Flag-KAP1 in B299 cells. (I) YAP1 promoter and YAP1/TEAD transcriptional activity. (J) YAP1 and TEAD1 genomic regions with KAP1 ChIP-seq data.
Fig. 5.
Fig. 5.
KAP1 and HNRNPAB Interactions and Expression in Gastric Adenocarcinoma Cells. (A) UMAP of scRNA-seq data from 20 ascites peritoneal carcinomatosis (PC) specimens. (B) Feature plot showing the expression of EpCAM, KAP1, HNRNPAB, and YAP1 in scRNA-seq data from 20 ascites PC specimens. (C) Correlation of KAP1 and HNPNPAB in cancer cell cluster in scRNA-seq data from 20 ascites PC specimens. (D) mRNA expression levels of KAP1, HNRNPAB, and YAP1 in TCGA-STAD (stomach adenocarcinoma) and normal tissue groups. (E) Correlation between KAP1 and HNRNPAB in TCGA-STAD patients and normal tissue groups. (F) Correlation analysis of KAP1 and HNRNPAB, and KAP1 and YAP1 in mass spectrometry (MS) data. (G) Protein expression levels of KAP1, HNRNPAB, YAP in HFE145, GES, AGS, Snu-1, MKN45, KATOIII, GA0518, GA0804, and GA0825 cells. (H). Immunofluorescence (IF) staining of HNRNPAB in primary tumors and ascites in two GAC (gastric adenocarcinoma) patients, case #1 and case #2. (I) Immunoblots of HNRNPAB and KAP1 following co-immunoprecipitation of KAP1 in GA0804 and AGS cells (left); Immunoblots of HNRNPAB and YAP following co-immunoprecipitation of HNRNPAB AGS cells (right); (J) IF staining of KAP1 and Ki67 in B299 organoids and IF staining of HNRNPAB and YAP1 in B299 organoids. (K). IF co-staining of KAP1 and HNRNPAB, and YAP1 and Ki67 in control and KAP1 knockout (KO) cell. (L) Expression levels of HNRNPAB and YAP1 in 293T control and HNRNPAB overexpression cells, and B299 control and HNRNPAB overexpression cells. (M) Schematic representation of KAP1 function in the regulation of the YAP1 promoter.
Fig. 6.
Fig. 6.
Combinatory inhibition of KAP1 and YAP1 by their ASOs on GAC cells in vivo. (A–B) Schematic representation of KAP1 domains showing design of ASO. Treatment plan in GA0518 cells. (C) KAP1 expression by Western blot after ASO treatment. (D). PDX models are performed by subcutaneously injecting control and ASO-treated cells (KAP1 and YAP1). Average tumor volume was demonstrated in mice treated with KAP1 ASO and a combination of KAP1 and YAP1 for 4 weeks, with representative tumor pictures. (E) A hypothetical model for the role of KAP1 from corepressor to co-activator in GAC progress.

References

    1. Salati M, Orsi G, Smyth E, Aprile G, Beretta G, De Vita F, Di Bartolomeo M, Fanotto V, Lonardi S, Morano F, Pietrantonio F, Pinto C, Rimassa L, Vasile E, Vivaldi C, Zaniboni A, Ziranu P, Cascinu S, Gastric cancer: translating novels concepts into clinical practice, Cancer Treat Rev. 79 (2019) 101889. - PubMed
    1. Thrift AP, El-Serag HB, Burden of gastric cancer, Clin. Gastroenterol. Hepatol 18 (2020) 534–542. - PMC - PubMed
    1. Lei T, Lin Y, Lai X, Zhang Y, Ma Y, Wang X, Liu W, Tang Q, Yang T, Feng W, Song W, ITGB5 facilitates gastric cancer metastasis by promoting TGFBR2 endosomal recycling, Cancer Lett. 592 (2024) 216953. - PubMed
    1. Zhang J, Fu L, Wang H, Yonemura A, Semba T, Yasuda-Yoshihara N, Nishimura A, Tajiri T, Tong Y, Yasuda T, Uchihara T, Yamazaki M, Okamoto Y, Yamasaki J, Nagano O, Baba H, Ishimoto T, RAC1-mediated integrin alpha-6 expression in E-cadherin-deficient gastric cancer cells promotes interactions with the stroma and peritoneal dissemination, Cancer Lett. 591 (2024) 216901. - PubMed
    1. Czerwinska P, Mazurek S, Wiznerowicz M, The complexity of TRIM28 contribution to cancer, J. Biomed. Sci 24 (2017) 63. - PMC - PubMed

MeSH terms

Substances