. 2025 Apr 7;23(1):209.
doi: 10.1186/s12916-025-04043-9.

Double-negative T cells in combination with ursodeoxycholic acid ameliorates immune-mediated cholangitis in mice

Affiliations

Double-negative T cells in combination with ursodeoxycholic acid ameliorates immune-mediated cholangitis in mice

Chunpan Zhang et al. BMC Med. .

Abstract

Background: Primary biliary cholangitis (PBC) is a liver-specific autoimmune disease. Treatment of PBC with ursodeoxycholic acid (UDCA) is not sufficient to prevent disease progression. Our previous study revealed that the number of hepatic double-negative T cells (DNT), which are unique regulatory T cells, was reduced in PBC patients. However, whether replenishment of DNT can prevent the progression of PBC remains unclear.

Methods: DnTGFβRII (Tg) mice and 2OA-BSA-immunized mice received DNT alone or in combination with oral UDCA. After 6-12 weeks of treatment, these mice were assessed for serological changes, liver pathological manifestations and intrahepatic immune responses.

Results: Adoptive transfer of DNT alone significantly decreased serum levels of alanine transaminase (ALT), aspartate transaminase (AST), antimitochondrial antibody M2 (AMA-M2) and immunoglobulin M (IgM) in both Tg and 2OA-BSA-immunized PBC mouse models. In addition, DNT exhibited a strong killing effect on liver T cells and strong inhibition of their proliferation, but did not significantly improve the histology of PBC liver. However, combination therapy with DNT and oral UDCA predominantly ameliorated liver inflammation and significantly inhibited hepatic T and B cells. In vitro further study revealed that UDCA up-regulated the proliferation of DNT, increased the expression of the functional molecule perforin, and reduced the expression of NKG2A and endothelial cell protein C receptor (EPCR) through the farnesoid X receptor (FXR)/JNK signaling pathway in both mice and human DNT.

Conclusions: A single transfer of DNT ameliorated PBC in mice, while combination therapy of DNT with oral UDCA displayed a better efficacy, with stronger inhibition of hepatic T and B cells. This study highlights the potential application of DNT-based combination therapy for PBC, especially for UDCA non-responders.

Keywords: Double-negative T cells; Farnesoid X receptor; Primary biliary cholangitis; Ursodeoxycholic acid.


Conflict of interest statement

Declarations. Ethics approval and consent to participate: The human DNT study was approved by the Research Ethics Committee of Beijing Friendship Hospital under ethics approval number 2020-P2-196-02, and informed consent from all healthy volunteers was obtained. All of the mice were housed and maintained in a pathogen-free, temperature-controlled environment at the Beijing Friendship Hospital under approval number 21-2011 for animal housing and use. All experimental procedures were conducted in accordance with the protocol approved by the Institutional Animal Care and Ethics Committee at Beijing Friendship Hospital and with the National Institutes of Health guidelines for the care and use of laboratory animals. Consent for publication: All authors read and approved the manuscript. Competing interests: The authors declare no competing interests.

Figures

Fig. 1
Fig. 1
Single DNT treatment alone or in combination with UDCA improved PBC. A Distribution of infused DNT in vivo. B (Left) Proportion of total intrahepatic DNT within the CD3+ cell population. (Middle) Proportion of CD45.1+ DNT relative to the CD3+ cell population. (Right) Quantitation of the number of infused DNT in the liver. C Relative mRNA levels of chemokines, including Cxcl9, Cxcl10 and Cxcl11, in liver tissue. D, E Plasma ALT, AST, AMA-M2 and IgM levels. F Representative H&E (Hematoxylin & eosin) and Sirius red staining of liver paraffin sections. G Quantification of portal inflammation and bile duct damage in liver histology. H Quantification of the positive area of Sirius red staining in liver histology. I Relative mRNA expression levels associated with inflammation. n = 6 in each group. Statistical analysis for G (Right) was performed using the Kruskal-Wallis multiple comparisons test. Multiple comparisons were analyzed using one-way ANOVA followed by Bonferroni post hoc correction for normally distributed variables. *P ≤ 0.05; **P ≤ 0.01; ALT, alanine transaminase; AMA-M2, antimitochondrial antibody M2; AST, aspartate transaminase; Cxcl9, C-X-C motif chemokine ligand 9; Cxcl10, C-X-C motif chemokine ligand 10; Cxcl11, C-X-C motif chemokine ligand 11; DNT, double-negative T cells; H&E, hematoxylin & eosin; Ifng, interferon-gamma; IgM, immunoglobulin M; Il1b, interleukin 1beta; Il17a, interleukin 17a; LN, lymph node; Mcp1, monocyte chemoattractant protein-1;Tg, dnTGFβRII mice; UDCA, ursodeoxycholic acid
Fig. 2
Fig. 2
DNT treatment alone or in combination with UDCA extensively inhibited T cells and B cells in vivo. A The absolute number of intrahepatic CD45+ cells. B Representative flow cytometry images and statistical analysis of intrahepatic CD44+CD4+ and CD44+CD8+ T cells. C Representative flow cytometry images and statistical analysis of Annexin V+ percentages in intrahepatic CD4+ and CD8+ T cells. D Representative flow cytometry images of Ki67+ liver CD4+ and CD8+ T cells. E Statistical analysis of Ki67+ percentages in intrahepatic CD4+ and CD8+ T cells. F Statistical analysis of Annexin V+ liver CD19+ B and CD19+CD138+ plasma cells, as determined by flow cytometry. G Statistical analysis of Ki67+ intrahepatic CD19+ B and CD19+CD138+ plasma cells, as determined by flow cytometry. n = 6 in each group. Multiple comparisons were analyzed by one-way ANOVA followed by Bonferroni post hoc correction. *P ≤ 0.05; **P ≤ 0.01. Tg, dnTGFβRII mice; UDCA, ursodeoxycholic acid
Fig. 3
Fig. 3
UDCA augmented the immunosuppressive effect of DNT on T and B cells. Statistical analysis of Annexin V+ (A) and EdU+ DNT (B) cocultured with different concentrations of UDCA, as determined by flow cytometry (n = 5). Enriched GO (C) and KEGG (D) pathway analyses were performed on the significantly up- and downregulated genes in DNT. E Heatmap showing the up- and downregulated genes related to the regulation of leukocyte proliferation. F Heatmap showing the upregulated genes related to leukocyte-mediated cytotoxicity. G CD45.1-positive T cells were cocultured with control DNT or UDCA-stimulated DNT at a 4:1 ratio for 3 days in vitro. The apoptosis of CD4+ T cells and CD8+ T cells was detected by flow cytometry (n = 4). H Proliferation of CD4+ and CD8+ T cells, as determined by flow cytometry. I CD45.1-positive CD19+ B cells were cocultured with control DNT or UDCA-stimulated DNT at a 4:1 ratio for 3 days in vitro. Apoptosis of CD19+ B cells was detected by flow cytometry (n = 4). J The concentration of IgM in the supernatant of B cell cultures at 5 days (n = 4). K Representative flow cytometry images and statistical analysis of NKG2A+ DNT. L Relative levels of function-associated genes in DNT analyzed by quantitative real-time PCR. Experiments were repeated 2-3 times. Two-group comparisons were made via Student’s t test, and multiple comparisons were analyzed by one-way ANOVA followed by Bonferroni post hoc correction. *P ≤ 0.05; **P ≤ 0.01; NS, not significant. Fasl, fas ligand; Gzmb, granzyme B; Infg, interferon-gamma; NKG2A, also known as klrc1, killer cell lectin like receptor C1; Prf1, perforin 1; UDCA, ursodeoxycholic acid
Fig. 4
Fig. 4
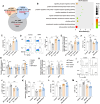
UDCA regulated the proliferation and function of DNT via FXR. DNT were stimulated with DMSO (60 μM), UDCA (60 μM), OCA (0.5 μM), UDCA (60 μM) + OCA (0.5 μM), GGS (5 μM) or GGS (5 μM) + UDCA (60 μM) for 48 h. Then, we detected the proliferation and NKG2A expression of the DNT. In addition, we cocultured these stimulated DNT with CD45.1-positive T cells or B cells for another 3 days. A Relative levels of Fxr, Pxr, Vdr and Tgr5 mRNAs in DNT, as analyzed by quantitative real-time PCR. B Statistical analysis of EdU+ and NKG2A+ cells relative to total DNT, as determined by flow cytometry (n = 5). C Apoptosis of CD4+ and CD8+ T cells was detected by flow cytometry (n = 5). D Statistical analysis of EdU + and NKG2A+ cells relative to the total DNT. E The apoptosis of CD4+ and CD8+ T cells was detected by flow cytometry (n = 5). F Statistical analysis of Annexin V+ B cells in each group (n = 5). G Statistical analysis of EdU+ cells relative to the total number of WT DNT and Fxr−/− DNT, as determined by flow cytometry (Left, n = 4). Relative changes in the presence or absence of UDCA in WT DNT compared with Fxr−/− DNT (Right). H Statistical analysis of NKG2A+ WT DNT and Fxr−/− DNT, as determined by flow cytometry (Left, n = 4). Relative changes in NKG2A in the presence or absence of UDCA in WT DNT compared with Fxr−/− DNT (Right). I Apoptosis of CD4+ and CD8+ T cells was detected via flow cytometry (n = 4). Experiments were repeated three times. Differences between two groups were analyzed via Student’s t test, and multiple comparisons were analyzed by one-way ANOVA followed by Bonferroni post hoc correction. *P ≤ 0.05; **P ≤ 0.01; NS, not significant. Fxr, farnesoid X receptor; Fxr−/−, Fxr knockout; NKG2A, also known as klrc1, killer cell lectin like receptor C1; OCA, obeticholic acid; Pxr, pregnane X receptor; TNF-α, tumor necrosis factor alpha; Tgr5, g-protein coupled receptor 5; UDCA, ursodeoxycholic acid; Vdr, vitamin D receptor; GGS, z-guggulsterone
Fig. 5
Fig. 5
UDCA regulated the proliferation and EPCR expression of DNT via the FXR/JNK pathway. WT and Fxr−/− DNT were stimulated with anti-mouse CD3/CD28 antibodies with or without 60 µM UDCA for 48h. A A total of 593 DEGs were identified between control WT DNT and UDCA-stimulated WT DNT. A total of 7402 non-DEGs were identified between control Fxr−/− DNT and UDCA-stimulated Fxr−/− DNT. Moreover, 907 DEGs were identified between WT DNT and Fxr−/− DNT stimulated with UDCA. A Venn diagram revealed that these three datasets shared 22 genes. B Enriched GO pathway analyses were performed based on these 22 genes. C The FPKM level in DNT detected by RNA-seq. D Representative flow cytometry images and statistical analysis of the percentages of EPCR+ cells relative to total DNT, as quantified by flow cytometry. E Relative levels of Epcr mRNA in DNT analyzed by quantitative real-time PCR. F To detect the effect of EPCR, DNT were treated with WA (0.2 µM, Cat#: HY-N2065, MCE) or UDCA (60 µM) for 48 h. Statistical analysis of the percentages of EdU+ cells relative to the total DNT was performed, and the percentages were quantified by flow cytometry. G Relative levels of Prf1, Gzmb and Klrc1 mRNAs in DNT were analyzed by quantitative real-time PCR. H Relative levels of Jnk-1 and Jnk-2 in DNT were analyzed by quantitative real-time PCR. I, J Representative flow cytometry images and statistical analysis of the level of p-JNK relative to total DNT, as quantified by flow cytometry. K Relative levels of Epcr mRNA in DNT were analyzed by quantitative real-time PCR. L, M Statistical analysis of the percentages of EPCR+ and EdU+ cells relative to total DNT, as quantified by flow cytometry. Experiments were repeated 2-3 times. Multiple comparisons were analyzed by one-way ANOVA followed by Bonferroni post hoc correction. *P ≤ 0.05; **P ≤ 0.01; NS, not significant. DNT, double-negative T cells; EPCR, endothelial cell protein C receptor; FPKM, fragments per kilobase of exon model per million mapped fragments; Fxr−/−, Fxr knockout; Gzmb, granzyme B; Jnk, c-Jun N-terminal kinase; JNK, c-Jun N-terminal kinase; JNK-IN8, JNK inhibitor XVI; Klrc1, killer cell lectin-like receptor C1; Infg, interferon-gamma; Prf1, perforin 1; UDCA, ursodeoxycholic acid; WA, withaferin A
Fig. 6
Fig. 6
UDCA enhanced the therapeutic role of DNT in vivo. A Flowchart showing that 6-8-week-old dnTGFβRII mice received a total of 3 × 106 CD45.1-positive DNT via tail vein injection. At the same time, UDCA (15 mg/kg/day) was administered daily by intragastric administration for 1 week (n = 6). B Representative flow cytometry images and statistical analysis of transferred CD45.1+ DNT in total hepatic CD45+ cells. Representative flow cytometry images and statistical analysis of Annexin V+ cells relative to the total CD45.1-positive DNT. C Statistical analysis of Ki67+ cells relative to the total CD45.1-positive DNT, as determined by flow cytometry. D Representative flow cytometry images and statistical analysis of NKG2A+ and granzyme B+ cells relative to the total CD45.1-positive DNT. E, F Representative flow cytometry images and statistical analysis of FXR+ cells relative to the total CD45.1-positive DNT. G Representative flow cytometry images and statistical analysis of EPCR+ or p-JNK+ cells relative to the total CD45.1-positive DNT. Two-group comparisons were made by Student’s t test followed by Bonferroni post hoc correction. *P ≤ 0.05; **P ≤ 0.01; NS, not significant. DNT, double-negative T cells; FXR, farnesoid X receptor; EPCR, endothelial cell protein C receptor; JNK, c-Jun N-terminal kinase; NKG2A, also known as klrc1, killer cell lectin like receptor C1; Tg, dnTGFβRII mice; UDCA, ursodeoxycholic acid
Fig. 7
Fig. 7
UDCA also regulates human DNT proliferation and immunoregulatory functions. A Relative levels of function-associated genes in human DNT analyzed by quantitative real-time PCR. B Representative flow cytometry images and statistical analysis of the percentages of perforin+, granzyme B+ and EdU+ cells relative to the total DNT, as quantified by flow cytometry. C T or B cells were cocultured with control DNT or UDCA-stimulated DNT at a 5:1 ratio for 1 day in vitro. The apoptosis of CD4+ and CD8+ T cells (left) and CD19+ cells (right) was detected by flow cytometry (n = 4). D Relative levels of Fxr, Pxr, Vdr and Tgr5 mRNAs in DNT, as analyzed by quantitative real-time PCR. E The mean fluorescence intensity (MFI) of FXR on DNT quantified by flow cytometry. F Representative flow cytometry images and statistical analysis of the percentages of EPCR+ cells relative to the total DNT. G To detect the effects of EPCR, human DNT were treated with WA (0.2 µM) or UDCA (60 µM) for 48 h. Statistical analysis of the percentages of EdU+ cells and perforin+ cells relative to the total DNT was performed, and the percentages were quantified via flow cytometry. H Representative flow cytometry images and statistical analysis of the percentages of p-JNK+ cells relative to the total DNT, as quantified by flow cytometry. I Statistical analysis of the percentages of perforin+ and EPCR+ cells relative to the total DNT, as quantified by flow cytometry. n = 4-6 per group. Experiments were repeated 2-3 times. Two-group comparisons were made via Student’s t test, and multiple comparisons were analyzed by one-way ANOVA followed by Bonferroni post hoc correction. *P ≤ 0.05; **P ≤ 0.01; NS, not significant. DNT, double-negative T cells; EPCR, endothelial cell protein C receptor; Fasl, fas ligand; Fxr, farnesoid X receptor; Gzmb, granzyme B; Infg, interferon-gamma; JNK, c-Jun N-terminal kinase; Klrc1, killer cell lectin like receptor C1; Prf1, perforin 1; Pxr, pregnane X receptor; Tgr5, g-protein coupled receptor 5; UDCA, ursodeoxycholic acid; Vdr, vitamin D receptor; WA, withaferin A

Similar articles

References

    1. Carbone M, Sharp SJ, Flack S, Paximadas D, Spiess K, Adgey C, et al. The UK-PBC risk scores: Derivation and validation of a scoring system for long-term prediction of end-stage liver disease in primary biliary cholangitis. Hepatology. 2016;63:930–50. - PMC - PubMed
    1. Mayo MJ. Mechanisms and molecules: What are the treatment targets for primary biliary cholangitis? Hepatology. 2022;76:518–31. - PubMed
    1. Melchor-Mendoza YK, Martinez-Benitez B, Mina-Hawat A, Rodriguez-Leal G, Duque X, Moran-Villota S. Ursodeoxycholic acid therapy in patients with primary biliary cholangitis with limited liver transplantation availability. Ann Hepatol. 2017;16:430–5. - PubMed
    1. Brandt D, Hedrich CM. TCRαβ(+)CD3(+)CD4(-)CD8(-) (double negative) T cells in autoimmunity. Autoimmun Rev. 2018;17:422–30. - PubMed
    1. Zhang D, Yang W, Degauque N, Tian Y, Mikita A, Zheng XX. New differentiation pathway for double-negative regulatory T cells that regulates the magnitude of immune responses. Blood. 2007;109:4071–9. - PMC - PubMed

Substances

LinkOut - more resources