

An integrated proteomic classifier to distinguish benign from malignant pulmonary nodules
- PMID: 40189512
- PMCID: PMC11974211
- DOI: 10.1186/s12014-025-09532-w
An integrated proteomic classifier to distinguish benign from malignant pulmonary nodules
Abstract
Background: Pulmonary nodule with diameters ranging 8-30 mm has a high occurrence rate, and distinguishing benign from malignant nodules can greatly improve the patient outcome of lung cancer. However, sensitive and specific liquid-biopsy methods have yet to achieve satisfactory clinical goals.
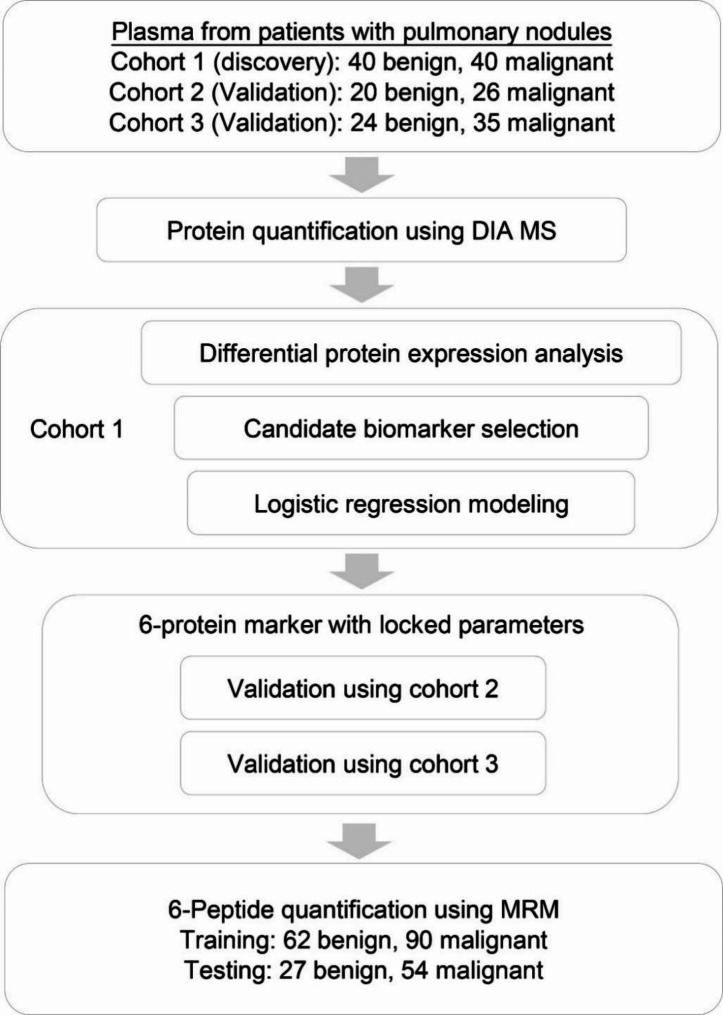
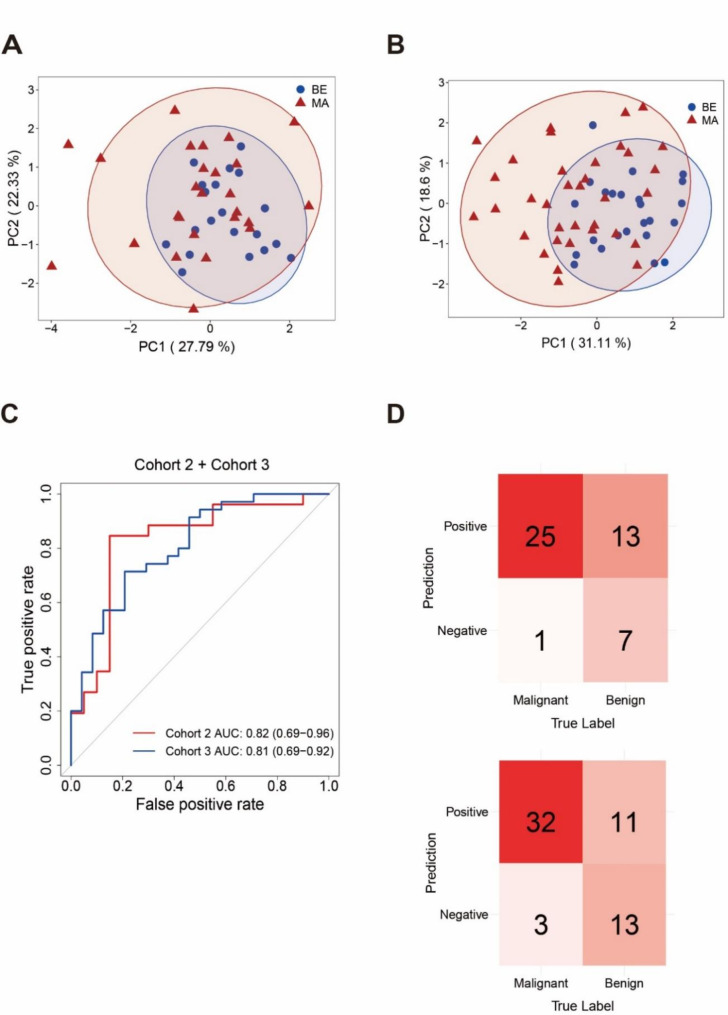
Methods: We enrolled three cohorts and a total of 185 patients diagnosed with benign (BE) and malignant (MA) pulmonary nodules. Utilizing data-independent acquisition (DIA) mass spectrometry, we quantified plasma proteome from these patients. We then performed logistic regression analysis to classify benign from malignant nodules, using cohort 1 as discovery data set and cohort 2 and 3 as independent validation data sets. We also developed a targeted multi-reaction monitoring (MRM) method to measure the concentration of the selected six peptide markers in plasma samples.
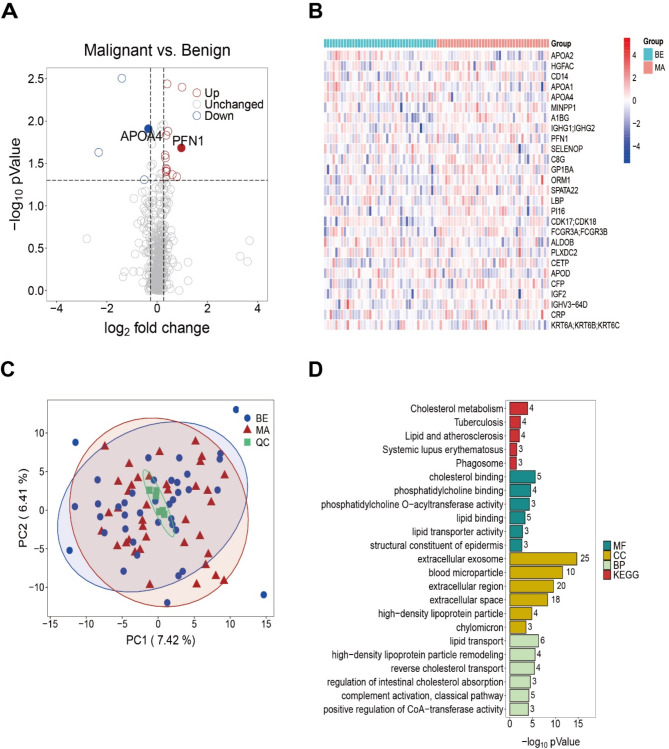
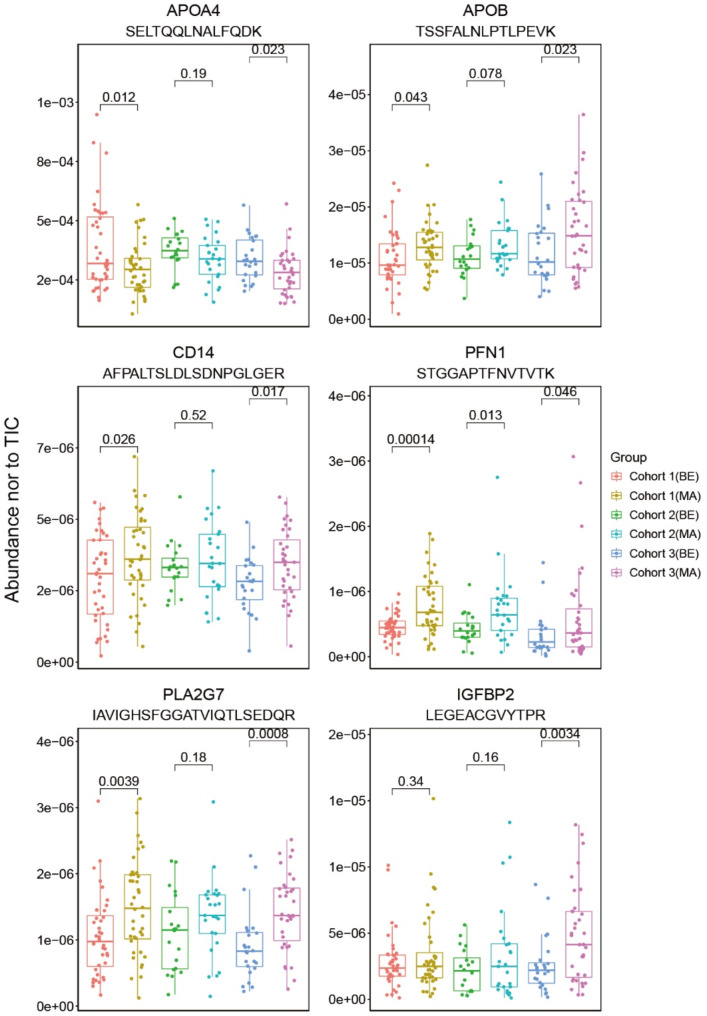
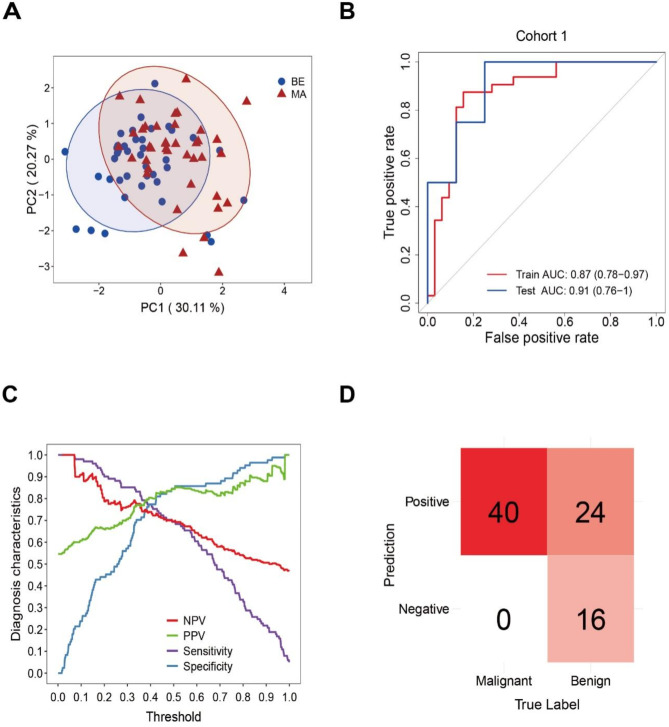
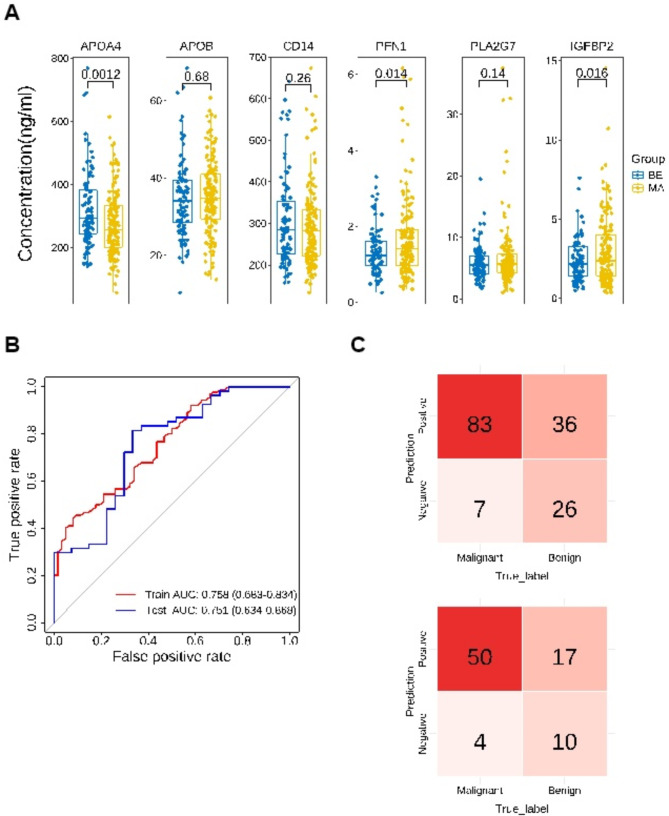
Results: We quantified a total of 451 plasma proteins, with 15 up-regulated and 5 down-regulated proteins from patients diagnosed as having malignant nodules. Logistic regression identified a six-protein panel comprised of APOA4, CD14, PFN1, APOB, PLA2G7, and IGFBP2 that classifies benign and malignant nodules with improved accuracy. In cohort 1, the area under curve (AUC) of the training and testing reached 0.87 and 0.91, respectively. We achieved a sensitivity of 100%, specificity of 40%, positive predictive value (PPV) of 62.5%, and negative predictive value (NPV) of 100%. In two independent cohorts, the 6-biomarker panel showed a sensitivity, specificity, PPV, and NPV of 96.2%, 35%, 65.8%, and 87.5% respectively in cohort 2, and 91.4%, 54.2%, 74.4%, and 81.3% respectively in cohort 3. We performed a targeted LC-MS/MS method to quantify plasma concentration of the six peptides and applied logistic regression to classify benign and malignant nodules with AUC of the training and testing reached 0.758 and 0.751, respectively.
Conclusions: Our study identified a panel of plasma protein biomarkers for distinguishing benign from malignant pulmonary nodules that worth further development into a clinically valuable assay.
Keywords: Biomarker; Classification; Lung cancer; Plasma; Pulmonary nodule.
© 2025. The Author(s).
Conflict of interest statement
Declarations. Ethics approval and consent to participate: All the studies mentioned in this article were approved by the Ethics Committee, and written informed consent was obtained by all the participant. Consent for publication: Not applicable. Competing interests: The authors declare no competing interests.
Figures
Similar articles
-
Assessment of Plasma Proteomics Biomarker's Ability to Distinguish Benign From Malignant Lung Nodules: Results of the PANOPTIC (Pulmonary Nodule Plasma Proteomic Classifier) Trial.Chest. 2018 Sep;154(3):491-500. doi: 10.1016/j.chest.2018.02.012. Epub 2018 Mar 1. Chest. 2018. PMID: 29496499 Free PMC article.
-
Diagnosis of Benign and Malignant Pulmonary Ground-Glass Nodules Using Computed Tomography Radiomics Parameters.Technol Cancer Res Treat. 2022 Jan-Dec;21:15330338221119748. doi: 10.1177/15330338221119748. Technol Cancer Res Treat. 2022. PMID: 36259167 Free PMC article.
-
Combining serum miRNAs, CEA, and CYFRA21-1 with imaging and clinical features to distinguish benign and malignant pulmonary nodules: a pilot study : Xianfeng Li et al.: Combining biomarker, imaging, and clinical features to distinguish pulmonary nodules.World J Surg Oncol. 2017 May 25;15(1):107. doi: 10.1186/s12957-017-1171-y. World J Surg Oncol. 2017. PMID: 28545454 Free PMC article.
-
Enhancing the differential diagnosis of small pulmonary nodules: a comprehensive model integrating plasma methylation, protein biomarkers, and LDCT imaging features.J Transl Med. 2024 Oct 31;22(1):984. doi: 10.1186/s12967-024-05723-5. J Transl Med. 2024. PMID: 39482707 Free PMC article.
-
[Value of peripheral blood rare cell EGFR gene amplification detection in the evaluation of benign and malignant pulmonary nodules].Zhonghua Yi Xue Za Zhi. 2024 May 14;104(18):1584-1589. doi: 10.3760/cma.j.cn112137-20231208-01318. Zhonghua Yi Xue Za Zhi. 2024. PMID: 38742345 Chinese.
References
-
- Mazzone PJ, Lam L. Evaluating the patient with a pulmonary nodule: A review. JAMA. 2022;327(3):264–73. 10.1001/jama.2021.24287. - PubMed
-
- Oudkerk M, Liu S, Heuvelmans MA, Walter JE, Field JK. Lung cancer LDCT screening and mortality reduction - evidence, pitfalls and future perspectives. Nat Rev Clin Oncol. 2021;18(3):135–51. 10.1038/s41571-020-00432-6. - PubMed
LinkOut - more resources
Full Text Sources
Research Materials
Miscellaneous