. 2025 Apr 6;16(1):3287.
doi: 10.1038/s41467-025-58457-3.

Aneuploidy confers a unique transcriptional and phenotypic profile to Candida albicans

Affiliations

Aneuploidy confers a unique transcriptional and phenotypic profile to Candida albicans

Anna I Mackey et al. Nat Commun. .

Abstract

Inaccurate chromosome segregation can lead to the formation of aneuploid cells that harbor an imbalanced complement of chromosomes. Several fungal species are not only able to tolerate the detrimental effects of aneuploidy but can use it to adapt to environmental pressures. The fungal pathobiont Candida albicans frequently acquires supernumerary chromosomes that enable growth in the presence of antifungal drugs or in specific host niches, yet the transcriptional changes associated with aneuploidy are not globally defined. Here, a karyotypically diverse set of C. albicans strains revealed that expression generally correlated with gene copy number regardless of the strain karyotype. Unexpectedly, aneuploid strains shared a characteristic transcriptional profile that was distinct from a generalized environmental stress response previously defined in aneuploid yeast cells. This aneuploid transcriptional response led to altered growth and oxidative balances relative to euploid control strains. The increased expression of reactive oxygen species (ROS) mitigating enzymes in aneuploid cells reduced the levels of ROS but caused an acute sensitivity to both internal and external sources of oxidative stress. Taken together, our work demonstrates common transcriptional and phenotypic features of aneuploid C. albicans cells with consequences for infection of different host niches and susceptibility to environmental stimuli.


Conflict of interest statement

Competing interests: The authors declare no competing interests.

Figures
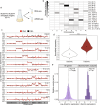
Fig. 1
Fig. 1. Expression increases in proportion with copy number.
a Schematic depicting growth of the strains used in this study for transcriptional and DNA profiling. Progeny cultures were grown in YPD medium in logarithmic phase to 2 × 10⁷ cells/mL were split into two aliquots, one for selective genotyping to define the karyotype and the other for expression profiling by RNA sequencing (RNA-Seq). Created in BioRender. Gusa, A. (2025) https://BioRender.com/i95e847. b Karyotypes of parasexual progeny were determined and depicted as a heat map where the block intensity indicates the number of strains with each aneuploid karyotype. c The log2 ratio of RNA (red) and DNA (black) counts relative to the diploid control were fitted with a LOESS method first degree local polynomial regression for a diploid progeny and nine representative aneuploid strains. Data is plotted based on its chromosomal position and the eight chromosomes are plotted separately. d The median expression value for each chromosome was normalized relative to the diploid control. Expression values were then separated by the DNA copy number as either disomic (open) or trisomic (maroon) and plotted for all 36 aneuploid strains. Significance was determined by Wilcoxon test. *** denotes p < 2E-16. e The expression of all genes (left) or a subset of 49 genes in stoichiometric complexes (right) that were found on trisomic chromosomes was normalized to the average expression on disomic chromosomes in aneuploid strains. Expression is plotted as a histogram of the log2 ratio of relative expression. The dashed line indicates a 1.5-fold increase in expression.
Fig. 2
Fig. 2. Aneuploid C. albicans strains express a distinct aneuploid stress response.
a Aneuploid stress responses were determined for each chromosome individually. Diploid control strains were compared to the expression across all aneuploid strains except those trisomic for that chromosome. Created in BioRender. Gusa, A. (2025) https://BioRender.com/f13d484. b Differentially expressed genes (DEGs) between aneuploid strains and the diploid control set were determined as greater than a 2-fold change and adjusted p value < 0.05 by Fisher’s Exact Test. These genes (N = 557) are plotted by transcript abundance (x-axis) and change in expression in aneuploid strains relative to the diploid strains (y-axis) as grey dots. Heat shock proteins (HSPs) are marked as black dots. c Heatmaps display expression values for differentially expressed genes on each chromosome. Strains are ordered from left to right by the amount of excess DNA in the aneuploid strain. Gene expression is shown only for strains disomic for that chromosome. d Gene Ontology processes with statistical enrichment in the aneuploidy stress response are shown with the number of contributing genes indicated (Fisher’s Exact test). e Transcriptional profiling of C. albicans in the same SC5314 genetic background was analyzed identically to the aneuploid stress response from Bruno et al.. Differentially expressed genes (2-fold change and q < 0.05) are displayed as yellow and magenta for increased and decreased transcript abundance, respectively. Genes without differential expression in any condition were excluded from the plot. Clustering was done using Manhattan distances and the number of DEGs for each condition is shown in parenthesis.
Fig. 3
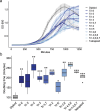
Fig. 3. Reduced growth rates of aneuploid C. albicans strains.
a Growth curves in liquid YPD at 30 °C during a 21-hour window are shown for 10 aneuploid strains (in blue), the diploid control (in dark grey), and tetraploid control (in light grey). OD600 measurements are shown in 15-minute intervals with standard deviations. Data are plotted as the mean with error bars indicating the standard deviation. N = 4. b The average doubling time during exponential growth was calculated for all strains and plotted as the mean and interquartile ranges (IQR) with whiskers extending to 1.5 × IQR. Data points extending beyond 1.5 × IQR are plotted individually. Strains are ordered from left to right by the amount of excess DNA in the aneuploid strain. N = 4. Significance was determined by two-sided Student’s t-test relative to the diploid strain without multiple comparison adjustments. * denotes p < 0.05. ** denotes p < 0.01. *** denotes p < 0.001.
Fig. 4
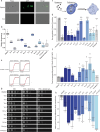
Fig. 4. Aneuploid strains are susceptible to ROS via redox imbalance.
a Logarithmic phase C. albicans cells were stained with 476 μM H2DCF-DA for 30 minutes and imaged by differential interference contrast (DIC) and fluorescence microscopy. Scale bar = 5 µm. b Quantification of H2DCF-DA fluorescence is plotted as the mean and interquartile ranges (IQR) with whiskers extending to 1.5 × IQR. Data points extending beyond 1.5 × IQR are plotted individually. N = 3. Significance was determined by Student’s t-test relative to the diploid control without multiple comparison correction, and all data are plotted as the mean and interquartile ranges. c Schematic representing the origin of reactive oxygen species (ROS) from either exogenous or endogenous sources. d Strains were struck heavily onto high glucose pre-sporulation medium for 4 days and allowed to grow at 37 °C. Cells were suspended in a 1:3000 dilution of propidium iodide (PI) and the fraction of PI positive cells determined by flow cytometry of 50,000 events. Significance was determined by the Wilcoxon test, and data was plotted as the mean with the error bars indicating the standard deviation. N = 9. e A polynomial curve was fit to the growth curve over 36 hours. Exogenous ROS sensitivity was determined by comparing the time taken to reach 0.4 OD600 between cultures grown in 0 mM and 2.5 mM H2O2, and (f) plotted for the indicated strains. Significance was determined by Wilcoxon test, and data plotted as the mean with error bars indicating the standard deviation. N = 4. g Cells from the diploid and ten aneuploid strains were incubated for 30 minutes in liquid YPD supplemented with 0, 40, or 80 mM H2O2. Ten-fold dilutions were spotted as 5 μL onto YPD solid agar medium and imaged after 24 hours. h Significance was determined by Wilcoxon test of the 40 mM:0 mM H2O2 second spot dilution pixel intensity between aneuploid strains and the diploid control. N = 3 except for diploid where N = 6. Data is plotted with the mean and error bars that indicate the standard deviation. Aneuploid strains are shown in blue and the diploid and tetraploid controls in dark and light grey, respectively. * denotes p <  0.05. ** denotes p < 0.01. *** denotes p < 0.001.
Fig. 5
Fig. 5. The aneuploidy stress response results from unbalanced chromosomal gains.
a Gene Ontology processes enriched among the 524 differentially expressed genes (2-fold change and q < 0.05) comparing isogenic diploid and tetraploid strains is shown with the number of contributing genes indicated. b Comparison of differentially expressed genes (DEGs) with transcript abundance either decreased (left, in purple) or increased (right, in yellow) in the aneuploid strain set or tetraploid mating products relative to the diploid background strains. Expression of DEGs in common is displayed as a heatmap and ordered by increasing change in the aneuploid stress response.

References

    1. Torres, E. M. et al. Effects of aneuploidy on cellular physiology and cell division in haploid yeast. Science317, 916–924 (2007). - PubMed
    1. Hassold, T. J. A cytogenetic study of repeated spontaneous abortions. Am. J. Hum. Genet32, 723–730 (1980). - PMC - PubMed
    1. Williams, B. R. et al. Aneuploidy affects proliferation and spontaneous immortalization in mammalian cells. Science322, 703–709 (2008). - PMC - PubMed
    1. Sheltzer, J. M., Torres, E. M., Dunham, M. J. & Amon, A. Transcriptional consequences of aneuploidy. Proc. Natl Acad. Sci. USA109, 12644–12649 (2012). - PMC - PubMed
    1. Wang, F. et al. Integrated transcriptomic-genomic tool Texomer profiles cancer tissues. Nat. Methods16, 401–404 (2019). - PMC - PubMed

MeSH terms

LinkOut - more resources