. 2025 Apr 6;15(1):11780.
doi: 10.1038/s41598-025-96248-4.

Active regulatory elements recruit cohesin to establish cell specific chromatin domains

Affiliations

Active regulatory elements recruit cohesin to establish cell specific chromatin domains

Emily Georgiades et al. Sci Rep. .

Abstract

As the 3D structure of the genome is analysed at ever increasing resolution it is clear that there is considerable variation in the 3D chromatin architecture across different cell types. It has been proposed that this may, in part, be due to increased recruitment of cohesin to activated cis-elements (enhancers and promoters) leading to cell-type specific loop extrusion underlying the formation of new sub-TADs. Here we show that cohesin correlates well with the presence of active enhancers and that this varies in an allele-specific manner with the presence or absence of polymorphic enhancers which vary from one individual to another. Using the alpha globin cluster as a model, we show that when all enhancers are removed, peaks of cohesin disappear from these regions and the erythroid specific sub-TAD is no longer formed. Re-insertion of the major alpha globin enhancer (R2) is associated with re-establishment of recruitment and increased interactions. In complementary experiments insertion of the R2 enhancer element into a "neutral" region of the genome recruits cohesin, induces transcription and creates a new large (75 kb) erythroid-specific domain. Together these findings support the proposal that active enhancers recruit cohesin, stimulate loop extrusion and promote the formation of cell specific sub-TADs.


Conflict of interest statement

Declarations. Competing interests: J.R.H. is founder, shareholder, and paid consultant of Nucleome Therapeutics. J.R.H hold patents for Capture-C (WO2017068379A1, EP3365464B1, US10934578B2). T.A.M. is a shareholder in and consultant for Dark Blue Therapeutics. This author declares no other financial or non-financial interests. The remaining authors declare no competing interests.

Figures
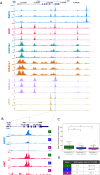
Fig. 1
Fig. 1
The presence of enhancers can vary naturally in a population. Sequences showing the characteristic chromatin marks of enhancers are positively correlated with cohesin occupancy. (A) An example of a site with natural variation of enhancer signal across the three donors and the correlation with cohesin occupancy. Region shown is chr5:177,367,955 − 177,373,964 (hg38). Numbers 1, 2, 3 on each track indicate the anonymized donor identifiers. ChIP-seq for RAD21, CTCF and histone marks (H3K4me1, H3K4me3, H3K27ac) are shown for each donor in the top panel along with the open chromatin signal (ATAC-seq). The region highlighted in blue is shown in detail in (B). (B) Zoom in on the enhancer peak where the signal across the donors varies according to the genotype: donor 1 is homozygous (+/+) and displays a positive ATAC-seq signal and the greatest peak of RAD21, donor 2 is heterozygous (+/−) and displays a positive ATAC-seq signal and a moderate peak of RAD21, donor 3 is homozygous (−/−)with no ATAC-seq or RAD21 signal. The pink line indicates the SNP we have identified as potential causal for this difference across the donors. The UCSC Genome Browser (http://genome.ucsc.edu) was used for visualization of ATAC-seq, ChIP-seq and gene annotations tracks in both (A) and (B). (C) There is a positive correlation between the presence of enhancer signal and coverage of RAD21 suggesting active enhancers accumulate cohesin. For 51 regions in which there is a robust difference in ATAC-seq signal across the donors, RAD21 signal was calculated for the three donors and the donors classified as either homozygous +/+ signal (green), homozygous −/− (purple), or heterozygous (blue). Each of the 51 individual data points are plotted as grey dots. Statistical significance between pairs was calculated using the paired T-test, asterisk indicates p-value ≤ 0.05. Coverage was normalised by RPKM and by region size. Plotted using matplotlib (v3.4.3) library in python (v3.10.7) (D) Table indicating the SNP location for this example, and the variant and genotype associated with each donor. Additional examples are shown in Fig. S1–S2.
Fig. 2
Fig. 2
Cohesin accumulates at the sites of active enhancers from which chromatin contacts arise. (A) ATAC-seq and RAD21 ChIP-seq spanning the alpha globin locus (chr11:32,146,649 − 32,280,800, mm39). Alpha globin enhancers are highlighted in blue and the two alpha genes (α1 and α2) highlighted in pink. GENCODE VM32 genes within the region are shown at the top in dark blue. ATAC-seq and ChIP-seq tracks for RAD21 and CTCF are shown with corresponding model indicated to the left. Red crosses above tracks indicate which of the enhancers are knocked out. All bigwig tracks are RPKM normalised and plotted with bin size 1. The orientation of CTCF motifs are shown below the CTCF track in purple (forward) and used plotting the coverage in (B). (B) Cohesin residency within the region of the alpha globin SE is significantly reduced upon deletion of the enhancer elements. Bar plot showing the ratio of cohesin coverage inside (Region I in (A), chr11:32,188,452 − 32,249,902) versus outside (Region II in (A), chr11:32,300,054 − 32,391,239) the alpha globin SE region. Two replicates for WT and three replicates for the R2-only and SE KO model are plotted; each point represents one replicate. Error bars represent standard deviation across replicates. Plotted using matplotlib (v3.4.3) library in python (v3.10.7). (C) Tiled-C plots for the region chr11:31,818,001–32,690,000 (mm39), where the alpha-globin enhancers are active (erythroid cells), only the R2 enhancer is present and active (erythroid cells), and inactive (undifferentiated mES cells). Contact maps are present at 2 kb resolution. GENCODE VM35 track is shown below the three subplots. Marked by black squares is the region chr11:32,154,606 − 32,260,344 which containing the active region within the sub-TAD. (D) Activation of erythroid specific alpha globin enhancers coincides with a change in 3D domain structure. Figure shows comparison of the contact frequencies in the different models presented in (C). Upper triangle: interaction matrix for log2(R2/WT mES). Lower triangle: interaction matrix for log2(WT erythroid/WT mES), here the inactive alpha globin locus in ES cells is compared to the model in which only the R2 enhancer is present and active. Tiled-C in WT mESC was generated for inactive enhancers, in WT fetal liver for active enhancers and R2 only fetal liver model for R2 only. In both interaction plots data from the two states were normalized before plotting a log2 comparison of the chromatin interactions. ATAC and RAD21 ChIP-seq tracks are from the corresponding models, CTCF ChIP-seq is from WT mESC for the inactive model and WT embryoid body erythroid cells for the R2 only model. (E) The active alpha globin locus in WT Ter119 + fetal liver cells is next compared to the model in which only the R2 enhancer is present and active. Data from the two states were normalized before plotting a log2 comparison of the chromatin interactions across the locus in a fully active versus R2 only active states. Black arrow indicates the R2 enhancer, black oval highlights the region in which interaction frequencies are enriched in the WT over the R2 only model. Note: Datasets shown in C and D have been normalized in a pairwise manner for log2(R2/WT mES), log2(WT erythroid/WT mES) and log2(WT erythroid/R2) to account for the differences in sequencing depth across experiments. The UCSC Genome Browser (http://genome.ucsc.edu) was used for visualization of ATAC-seq, ChIP-seq and gene annotations tracks in (A), (C), (D) and (E). Tiled-C plots were created using HiCPlotter (v0.6.6).
Fig. 3
Fig. 3
Insertion of a 325 bp sequence containing the R2 alpha globin enhancer into a neutral region of the genome, initiates significant changes when activated by erythroid differentiation. (A) In erythroid cells, the insertion of the R2 enhancer element gives rise to novel peaks of open chromatin, H3K27Ac, RAD21 and de novo transcription. All data were generated in erythroid material derived from embryoid body culture. Top panel shows the data generated in wild-type cells, bottom panel shows data from R2-insertion model cells. Arrows highlight the RAD21 peaks discussed in the text. A putative CTCF motif identified to overlap RAD21 peak 3 by FIMO analysis, however no signal seen by CTCF ChIP-seq. (B) The inserted R2 element contacts sites upstream and downstream suggestive of domain formation. Comparison of the local genome topology around the R2 insertion site in R2-chrX erythroid cells versus WT. NG Capture-C interaction profile from the R2 (orange line) with a 1 kb exclusion zone around the viewpoint. WT profile is shown in purple and R2-chrX in turquoise. Each profile represents normalised, averaged unique interactions from three biological replicates. Standard deviation is represented as a halo around the average across a 3 kb sliding window. Genomic location and relative positioning of genes is shown below the interaction profile. Capture-C plot was created using CaptureCompare (see Methods section for details). (C) The R2 enhancer can initiate the formation of a sub-TAD when isolated outside of its usual chromosome context. Tiled-C heatmap showing the normalized interaction frequencies at 2 kb resolution across region chrX:10,875,000–11,705,000 (mm39). Arrow indicates the site in which R2 is inserted. Data is presented as a log2 comparison plot of two normalized Tiled-C experiments. Triangle contains a region of increased interactions when the R2 insertion model is compared to the WT and indicates the formation of a new sub-TAD. The oval outline indicates an additional stripe of newly formed interactions which suggest the activated elements within the domain are also forming longer-range interactions beyond the newly formed sub-TAD. Tandem repeats of the H2al1 genes result in multi mapping issues which explains the lack of signal detection from the region surrounding these genes. The UCSC Genome Browser (http://genome.ucsc.edu) was used for visualization of ATAC-seq, RNA-seq, ChIP-seq and gene annotations tracks in (A) and (C). Tiled-C plots were created using HiCPlotter (v0.6.6).

References

    1. Oudelaar, A. M. et al. Dynamics of the 4D genome during in vivo lineage specification and differentiation. Nat. Commun.11, 2722 (2020). - PMC - PubMed
    1. Dixon, J. R. et al. Chromatin architecture reorganization during stem cell differentiation. Nature518, 331–336 (2015). - PMC - PubMed
    1. Nora, E. P. et al. Spatial partitioning of the regulatory landscape of the X-inactivation centre. Nature485, 381–385 (2012). - PMC - PubMed
    1. Phillips-Cremins, J. et al. Architectural protein subclasses shape 3D organization of genomes during lineage commitment. Cell153, 1281–1295 (2013). - PMC - PubMed
    1. Miura, H. & Hiratani, I. Cell cycle dynamics and developmental dynamics of the 3D genome: Toward linking the two timescales. Curr. Opin. Genet. Dev.73, 101898 (2022). - PubMed

LinkOut - more resources