. 2025 Aug;32(8):1460-1472.
doi: 10.1038/s41418-025-01486-8. Epub 2025 Apr 6.

Folliculin depletion results in liver cell damage and cholangiocarcinoma through MiT/TFE activation

Affiliations

Folliculin depletion results in liver cell damage and cholangiocarcinoma through MiT/TFE activation

Bruno Maria Custode et al. Cell Death Differ. 2025 Aug.

Abstract

Mutations in the tumor suppressor gene Folliculin (FLCN) are responsible for Birt-Hogg-Dube' (BHD) syndrome, a rare inherited condition that predisposes affected individuals to skin tumors, pulmonary cysts, and kidney tumors. FLCN regulates key cellular pathways, including TFEB, TFE3, and mTORC1, which are critical for maintaining cell homeostasis. Loss of FLCN leads to both hyperactivation of mTORC1 and constitutive activation of TFEB and TFE3, contributing to tumorigenesis. While previous studies showed that Flcn liver-specific conditional knockout (FlcnLiKO) mice are protected from developing liver fibrosis and damage upon high-fat diet exposure, the potential role of FLCN loss in liver carcinogenesis remained unexplored. Here, we demonstrate that hepatic loss of FLCN in mice results in cancer associated with inflammation and fibrosis with features of cholangiocarcinoma (CCA). This phenotype emerges in mice over 90-week-old, with a male predominance. Moreover, FlcnLiKO mice are more prone to develop diethylnitrosamine (DEN)- or 3,5-diethoxycarbonyl-1,4-dihydrocollidine (DDC)- induced liver tumors with heterogenous histological features. Notably, depletion of TFE3, but not TFEB, in the liver of FlcnLiKO mice fully rescues the cancer phenotype and normalized mTORC1 signaling, highlighting TFE3 as the primary driver of liver cancer and mTORC1 hyperactivity in the absence of FLCN.


Conflict of interest statement

Competing interests: AB is cofounder and shareholder of CASMA Therapeutics, Inc, and Advisory board member of Avilar Therapeutics and Amplify Therapeutics. Ethics approval: The manuscript reporting studies did not involve human participants, human data or human tissue. The animal experiments were accomplished in compliance with ethical standards. All experiments were approved by the Italian Ministry of Health with the approved number CE571.65 and were performed in accordance with the legal mandates and federal guidelines for the care and maintenance of laboratory animals.

Figures
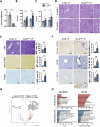
Fig. 1
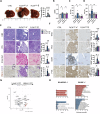
Fig. 1. Characterization of liver-specific Flcn knockout male mice.
A Flcn expression levels after CRE recombination in 12-week-old FlcnLiKO and control mice (n = 3 CTRL and n = 4 FlcnLiKO). Serum ALT (B) and AST (C) levels in FlcnLiKO (n = 6 at 4 weeks and n = 10 at 12 weeks) and control mice (n = 5 at 4 weeks and n = 7 at 12 weeks) at the indicated time points. D H&E staining of liver section from mice of the indicated genotypes at 4 and 12 weeks of age, showing clear cells and hepatocyte ballooning. Red arrows indicate immune infiltrates. E, F PAS and Sirius red staining (E), along with immunostaining for the indicated markers (F) in liver sections from 12-week-old FlcnLiKO and control male mice, with relative quantification (n = 3 per group). G Volcano plot of differentially expressed genes (DEGs) between 12-week-old male FlcnLiKO and control mice. H Gene Ontology (GO) analysis, including KEGG and Biological Process terms, highlighting significantly upregulated (red) and downregulated (blue) pathways in FlcnLiKO mice compared to control (FDR < 0.05). All the data refer to male mice. Each dot represents an individual mouse. Data are mean ± standard error. Statistical analysis: Student t-test *p-value < 0.05, **p-value < 0.01.
Fig. 2
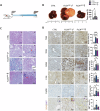
Fig. 2. Sexual dimorphism in TFE3 and TFEB activation in Flcn-depleted livers.
A Immunoblot analysis of TFE3, TFEB, and mTORC1 target P-4EBP1 in total liver lysate from male and female FlcnLiKO and control mice at 12 weeks of age, with relative quantifications (n = 3-4 per group). Nuclear fraction analysis with quantifications (n = 3-4 per group) (B) and immunostaining with relative quantifications (n = 3 per group) (C), showing TFE3 and TFEB nuclear localization in male and female FlcnLiKO and control mice. Each dot represents an individual mouse. Blue bars indicate male, and purple bars indicate female mice. Data are mean ± standard error. Statistical analysis: One-way ANOVA: *p-value < 0.05; **p-value < 0.01; ***p-value < 0.001 ; ****p-value < 0.0001.
Fig. 3
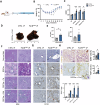
Fig. 3. Spontaneous development of liver tumors in FlcnLiKO mice.
AD. Gross liver appearance and tumor area quantification (n = 6 FlcnLiKO males and n = 5 FlcnLiKO females) (A), liver-to-body weight (LW/BW) ratio (B), serum ALT (C) and AST (D) levels in 90-week-old male and female FlcnLiKO mice and controls (n = 6 CTRL and n = 8 FlcnLiKO). Tumor area is represented as percentage of the total liver area. The arrow in (A) indicates liver tumor. E, F. Histological characterization of liver pathology in 90-week-old FlcnLiKO mice assessed by H&E, PAS, and Sirius red staining, as well as immunostainings for the indicated markers with relative quantifications (n = 3 per group). G Volcano plot of differentially expressed genes (DEGs) between 90-week-old male FlcnLiKO and control mice. H Gene Ontology (GO) analysis, including KEGG and Biological Process terms, highlighting significantly upregulated (red) and downregulated (blue) pathways in FlcnLiKO mice compared to control (FDR < 0.05). Each dot represents an individual mouse. Data are mean ± standard error. Statistical analysis: One-way ANOVA: *p-value < 0.05; **p-value < 0.01; ***p-value < 0.001; ****p-value < 0.0001.
Fig. 4
Fig. 4. DEN-induced tumorigenesis due to Flcn depletion.
A Schematic representation of the experimental plan. B Gross liver morphology and tumor area quantification in FlcnLiKO and control mice injected with DEN at P21 and collected 8 months post-injection. Tumor area is represented as a percentage relative to controls (n = 3 CTRL, n = 14 male FlcnLiKO mice, n = 3 female FlcnLiKO mice). C, D H&E staining (C) and immunostainings for the indicated markers with relative quantifications (n = 3 per group) (D) in liver sections from FlcnLiKO and control mice injected with DEN at P21 and collected 8 months post-injection. H&E staining reveals normal histological architecture in control mice (a,b), whereas FlcnLiKO mice exhibit various histological subtypes of hepatocellular carcinoma (HCC) and cholangiocarcinoma (CCA), including clear cells (c), lobular and trabecular formation (d), biliary reaction (e) cyst formation (f) and immune infiltrates (d,g,h). Red arrows indicate immune infiltrates. Each dot represents an individual mouse. Data are mean ± standard error. Statistical analysis: One-way ANOVA: *p-value < 0.05; **p-value < 0.01; ***p-value < 0.001; ****p-value < 0.0001.
Fig. 5
Fig. 5. Impaired cell homeostasis due to FLCN loss during chronic liver damage and recovery.
A Schematic representation of the experimental plan. B Change in body weight of FlcnLiKO and control mice during the injury protocol (n = 5 per group). C Liver-to-body weight (LW/BW) ratio of FlcnLiKO and control mice at the indicated time points during liver injury and recovery (n = 4-5 per group). D, E Gross liver appearance (D) and serum ALT and AST levels (E) in FlcnLiKO and control mice 2 weeks after removal of DDC-containing food (n = 5 per group). The blue arrow indicates a liver cyst. FH H&E staining (F) and immunostaining for the indicated markers (G, H) in liver sections from FlcnLiKO and control mice at the specified time points, with relative quantification (n = 3 per group). All the data refer to male mice. Each dot represents an individual mouse. Data are mean ± standard error. Statistical analysis: Two-way ANOVA or Student t-test: *p-value < 0.05; ****p-value < 0.0001.
Fig. 6
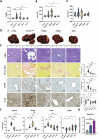
Fig. 6. TFE3 is the principal contributor to liver pathology in FlcnLiKO mice.
AE Liver-to-body weight (LW/BW) ratio (A) and serum ALT (B) and AST (C) levels in control, FlcnLiKO, FBKO, F3KO, and TKO mice 8 months after DEN injection (n = 12 CTRL and FlcnLiKO, n = 6 FBKO, F3KO, TKO). Gross liver morphology (D) and histological analysis with relative quantifications (n = 3 per group) (E), showing partial rescue upon TFEB depletion and complete rescue in TFE3- or TFEB/TFE3-depleted livers. F Gene expression analysis of the indicated genes in liver samples from mice of the indicated genotypes (n = 4 per group). G Luciferase assay of Sox9 promoter activity demonstrating transactivation upon TFEB and TFE3 overexpression (n = 3 per group). All the data refer to male mice. Each dot represents an individual mouse. Data are mean ± standard error. Statistical analysis: One-way ANOVA: *p-value < 0.05; **p-value < 0.01; ***p-value < 0.001; ****p-value < 0.0001.

References

    1. Rumgay H, Arnold M, Ferlay J, Lesi O, Cabasag CJ, Vignat J, et al. Global burden of primary liver cancer in 2020 and predictions to 2040. J Hepatol. 2022;77:1598–606. - PMC - PubMed
    1. Mancuso A. Management of hepatocellular carcinoma: enlightening the gray zones. World J Hepatol. 2013;5:302–10. - PMC - PubMed
    1. Zabron A, Edwards RJ, Khan SA. The challenge of cholangiocarcinoma: dissecting the molecular mechanisms of an insidious cancer. Dis Models Mech. 2013;6:281–92. - PMC - PubMed
    1. Melaram R. Environmental risk factors implicated in liver disease: a mini-review. Front Public Health. 2021;9:683719. - PMC - PubMed
    1. Suresh D, Srinivas AN, Kumar DP. Etiology of hepatocellular carcinoma: special focus on fatty liver disease. Front Oncol. 2020;10:601710. - PMC - PubMed

MeSH terms

Substances

LinkOut - more resources