. 2025 Apr 15;19(14):13673-13684.
doi: 10.1021/acsnano.4c14099. Epub 2025 Apr 6.

Dynamic Response of Concentrated Electrolytes to Chirp Signals

Affiliations

Dynamic Response of Concentrated Electrolytes to Chirp Signals

Emily Krucker-Velasquez et al. ACS Nano. .

Abstract

Electrolytes, chirp signals, Brownian dynamics, conductivity, Maxwell-Wagner relaxation This study investigates the dynamic response of electrolyte/macroion solutions to time-varying electric fields, which is vital for applications from water desalination to neuromorphic computing and sensor technologies. Using large-scale Brownian dynamics simulations coupled with Poisson's equation, we examined the frequency-dependent conductivity of symmetric and binary electrolytes/nanoparticles across various concentrations. We reveal a comprehensive picture of charge transport mechanisms by employing chirp signals that excite multiple frequencies. Our results identify three distinct dynamic regimes: (1) instantaneous response at low frequencies, (2) increased lagging and imaginary conductivity at intermediate frequencies, and (3) diminished conductivity at high frequencies due to short-time ion/macroion dynamics. Significant deviations from ideal behavior at low frequencies and high concentrations are attributed to packing and many-body interactions. We propose a modified Maxwell-Wagner relaxation time that incorporates excluded volume effects, offering a more accurate time scale for the dynamic response of concentrated electrolytes/macroions. This new framework scales the frequency-dependent conductivity, revealing universal responses across different concentrations and interaction strengths.

Keywords: charged nanoparticles; concentrated electrolytes; conductivity spectra; electrohydrodynamics; nonequilibrium transport.


Conflict of interest statement

The authors declare no competing financial interest.

Figures
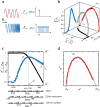
Figure 1
Figure 1
(a) (up) Diagram depicting a single tone applied field and that single tone excites the response at that particular frequency in the frequency spectrum. (bottom) An applied electric field whose frequency increases with time, known as a chirp signal, excites a range of frequencies as opposed to a single frequency. (b) 3D representation of dynamic conductivity as a function of the applied frequency in units of the ion diffusion time for a symmetric and binary electrolyte with ε = λB/2a = 2.0 and ϕ = 0.02. Black, blue, and red markers depict the projections on the real, σ′, imaginary, σ″, and frequency planes, respectively. (c) The projections of the frequency-dependent conductivity onto the real (black) and imaginary (blue) axes. The dashed gray line marks the crossover point between the real and imaginary contributions, denoted as the characteristic frequency of the suspension, ω*. (d) An example of a Nyquist plot, illustrating the imaginary component (y axis) versus the real component (x axis) of the conductivity. The value corresponding to the characteristic frequency, ω*, is labeled σ*. The solid purple lines indicate the extrapolation to the zero-frequency conductivity, σ0, and the infinite-frequency conductivity, σ. Although this representation resembles an impedance spectrum, it only captures the contributions from the ions in the bulk phase.
Figure 2
Figure 2
Computed (a) zero, σ0, and (b) infinity, σ, conductivities are shown as a function of the inverse Debye screening length in units of the particle’s radius κDa. A dashed black line illustrates the theoretical conductivity for an ideal electrolyte solution corresponding to each ε. For reference, black markers indicate experimental measurements from ref (34). Solid lines in subpanel (a) correspond to corrected NE conductivities if formula image, where ϕm is the maximum packing fraction. (c) Increment of the conductivity. The lowest value for the coupling parameter, ε = 0.5, is shown by blue circle markers, ε = 2.0 for orange square markers, and ε = 5.0 for green triangle markers.
Figure 3
Figure 3
Diagrams of the computed radial correlation functions g+– in the direction of extension (parallel to the applied electric field). The first and second columns correspond to the radial distributions sampled at frequencies ω/2π = 0.005τD–1 and ω/2π = 200τD–1, respectively. Subpanels a and b correspond to the semidilute regime with a total ion concentration of ϕ = 0.05. Subpanels c and d correspond to the highly concentrated regime with ϕ = 0.35. (e) Illustration of dynamic behavior leading to quadrupole distributions on the partial pair correlation functions in subpanels a and c.
Figure 4
Figure 4
Ions mean square displacement (MSD) as a function of Δt. The first, second, and third columns correspond to displacements sampled at frequencies that correspond to region I (ω ≪ ω*), II(ω < ω*), and III (ω > ω*), respectively. Subpanels a, b, and c correspond to the semidilute regime with a total ion concentration of ϕ = 0.05. Subpanels d, e, and f correspond to the highly concentrated regime with ϕ = 0.35. Notice the significant structural changes of the correlation function.
Figure 5
Figure 5
(a) Frequency response of the real contribution to the conductivity at different concentrations for E0 = 0.5 in units of kBT/a2εf and ε = 2.0. (b) Imaginary contribution to the frequency-dependent conductivity for E0 = 0.5 in units of kBT/a2εf and ε = 2.0. The Black markers indicate the location of the characteristic relaxation time of the suspension.
Figure 6
Figure 6
(a) A tracer particle, depicted in red, is encircled by neighboring particles, shown in blue, which form a cage-like structure. The tracer particle must await the relaxation of these neighboring particles before it can move beyond the confines of its cage. (b) The characteristic frequency, derived from the data, is presented as a function of the perturbed Maxwell–Wagner inverse relaxation time. The electric field is in units of kBT/a2εf. (c) Real component of the conductivity as a function of the rescaled frequency. At frequencies greater than the characteristic frequency, the rescaled conductivity decays as formula image. (c) Imaginary contribution to the frequency-dependent conductivity as a function of the rescaled frequency. At frequencies below ω/ω*, σ″ ∼ ω/ω* and at frequencies above ω/ω*, σ″ decays as formula image.

References

    1. Chen L.; Yin Z.; Li F.; Chen Z. Treatment of Simulated Saline Brine Water by Membrane Distillation Process Enhanced Through Alternating Current Electric Field. Chem. Eng. Res. Des. 2023, 192, 167–179. 10.1016/j.cherd.2023.02.035. - DOI
    1. Alkhadra M. A.; Conforti K. M.; Gao T.; Tian H.; Bazant M. Z. Continuous Separation of Radionuclides from Contaminated Water by Shock Electrodialysis. Environ. Sci. Technol. 2020, 54, 527–536. 10.1021/acs.est.9b05380. - DOI - PubMed
    1. Robin P.; Kavokine N.; Bocquet L. Modeling of Emergent Memory and Voltage Spiking in Ionic Transport Through Angstrom-Scale Slits. Science 2021, 373, 687–691. 10.1126/science.abf7923. - DOI - PubMed
    1. Noy A.; Li Z.; Darling S. B. Fluid Learning: Mimicking Brain Computing with Neuromorphic Nanofluidic Devices. Nano Today 2023, 53, 102043.10.1016/j.nantod.2023.102043. - DOI
    1. Boahen E. K.; Pan B.; Kweon H.; Kim J. S.; Choi H.; Kong Z.; Kim D. J.; Zhu J.; Ying W. B.; Lee K. J.; Kim D. H. Ultrafast, Autonomous Self-Healable Iontronic Skin Exhibiting Piezo-Ionic Dynamics. Nat. Commun. 2022, 13, 7699.10.1038/s41467-022-35434-8. - DOI - PMC - PubMed

LinkOut - more resources