. 2025 Dec;14(1):2485317.
doi: 10.1080/22221751.2025.2485317. Epub 2025 Apr 7.

A polyvalent DNA prime with matched polyvalent protein/GLA-SE boost regimen elicited the most robust and broad IgG and IgG3 V1V2 binding antibody and CD4+ T cell responses among 13 HIV vaccine trials

Affiliations

A polyvalent DNA prime with matched polyvalent protein/GLA-SE boost regimen elicited the most robust and broad IgG and IgG3 V1V2 binding antibody and CD4+ T cell responses among 13 HIV vaccine trials

Zoe Moodie et al. Emerg Microbes Infect. 2025 Dec.

Abstract

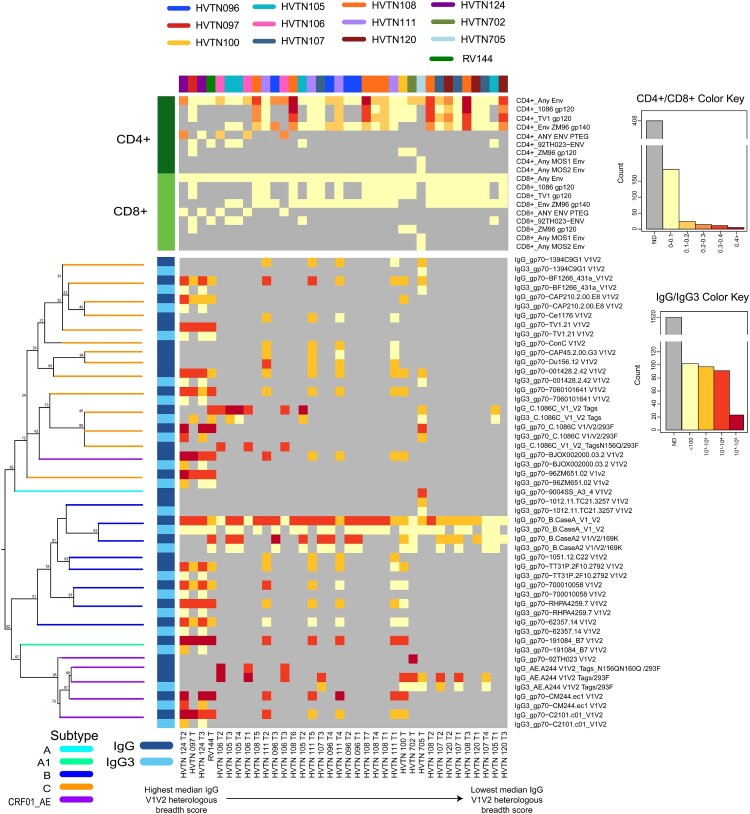
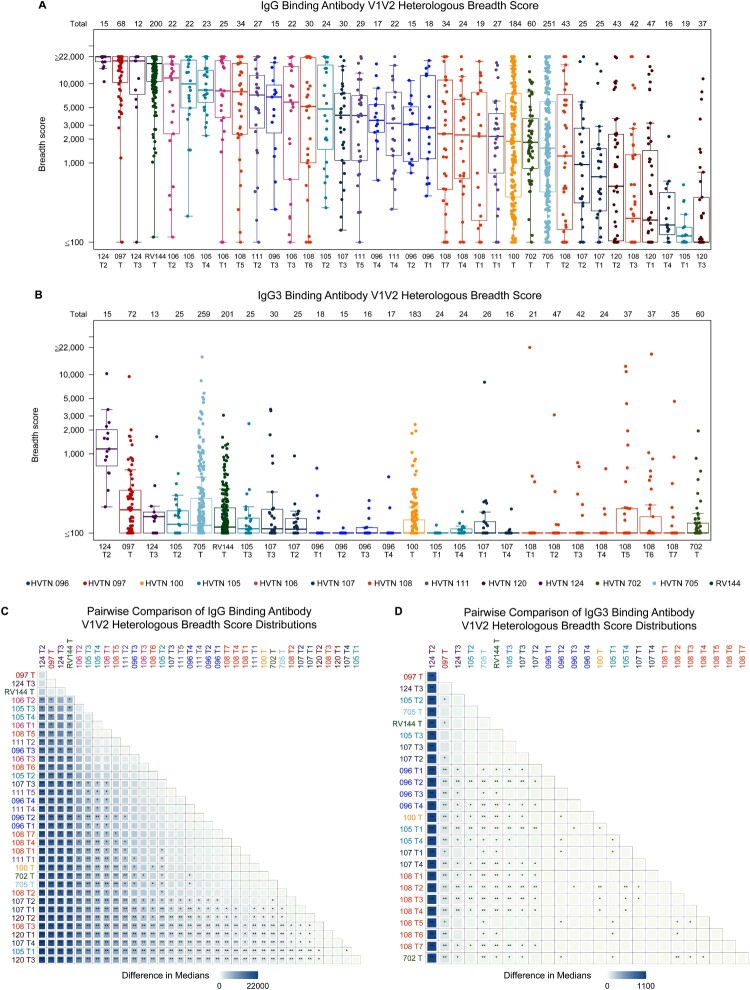
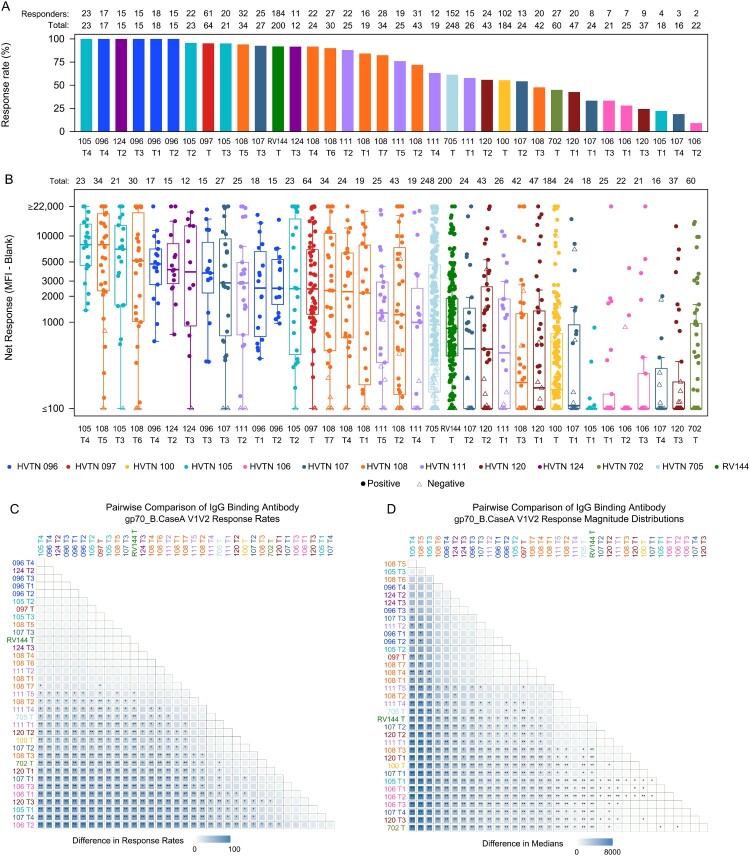
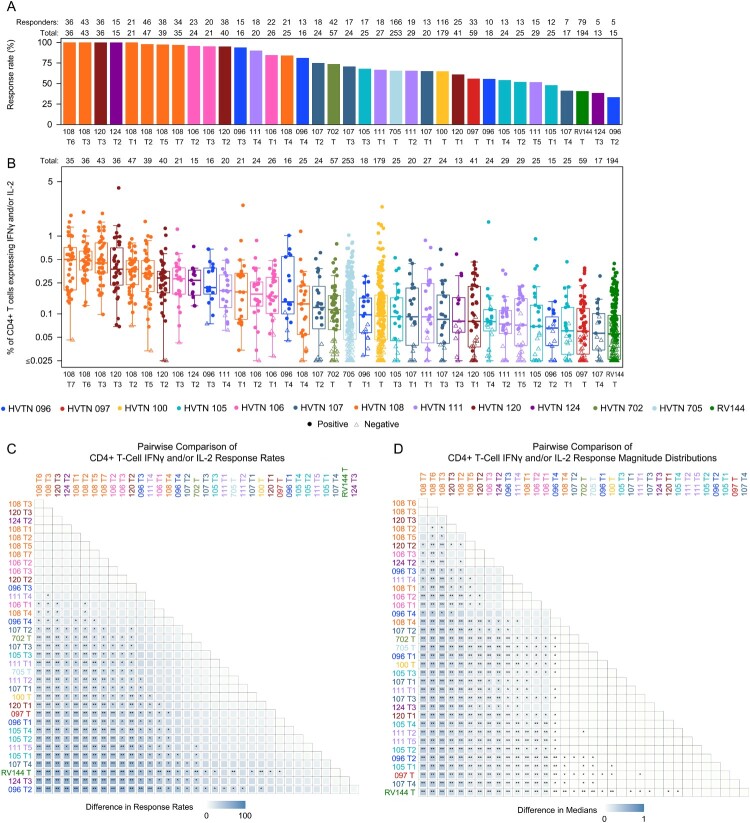
Developing an effective HIV vaccine is a momentous challenge. An exceptionally wide range of candidate HIV vaccines have been tested, yet many were poorly immunogenic, and of the select few that advanced into efficacy trials, only one demonstrated any efficacy. Here we report the results of the largest-scale cross-protocol immunogenicity comparison to date: 13 HIV vaccine trials (including 36 vaccine regimens) conducted across nine countries worldwide, strengthened by standardized trial designs, validated assays in centralized laboratories, and harmonized immunogenicity endpoints - providing an objective approach to identify the HIV vaccine candidate(s) with the best immunogenicity. A polyvalent DNA prime + protein boost regimen (HVTN 124) including Env immunogens of four subtypes, matched between prime and boost, achieved the best anti-V1V2 antibody responses by a large margin and also induced high CD4+ T-cell responses - two key immune responses implicated in HIV vaccine protection. Our results provide strong support to test this promising HIV vaccine design in more advanced phase clinical trials and will also guide the future design of additional HIV vaccines.Trial registration: ClinicalTrials.gov identifier: NCT01799954..Trial registration: ClinicalTrials.gov identifier: NCT02109354..Trial registration: ClinicalTrials.gov identifier: NCT02404311..Trial registration: ClinicalTrials.gov identifier: NCT02207920..Trial registration: ClinicalTrials.gov identifier: NCT02296541..Trial registration: ClinicalTrials.gov identifier: NCT03284710..Trial registration: ClinicalTrials.gov identifier: NCT02915016..Trial registration: ClinicalTrials.gov identifier: NCT02997969..Trial registration: ClinicalTrials.gov identifier: NCT03122223..Trial registration: ClinicalTrials.gov identifier: NCT03409276..Trial registration: ClinicalTrials.gov identifier: NCT02968849..Trial registration: ClinicalTrials.gov identifier: NCT03060629..Trial registration: ClinicalTrials.gov identifier: NCT00223080..

Keywords: Binding antibody multiplex assay; Env V1V2 binding antibody response breadth score; cross-protocol analysis; intracellular cytokine staining; matched polyvalent DNA-polyvalent protein/GLA-SE prime-boost regimen.


Conflict of interest statement

LNC was compensated for work on this manuscript through a consulting agreement with Fred Hutchinson Cancer Center. FT was an employee of Janssen/Johnson & Johnson at the time the work was conducted and owns stock in Johnson & Johnson. KM is a Member of the PrEPVACC TSC and a Member of the IDDO DAC (Infectious Disease data Observatory, Data Access Committee). Both are unpaid positions. L-GB has received honoraria in the past for advisories to Janssen/Johnson & Johnson, ViiV Healthcare, Gilead Sciences, and Merck PTY Ltd. None exceeded $2000 and all were unrelated to the topic of this manuscript. SL is a shareholder of Worcester HIV Vaccine.

Figures

Figure 1.
Figure 1.
Heatmap of regimen-specific median IgG and IgG3 response magnitudes to heterologous V1V2 antigens and median CD4 + and CD8+ T-cell IFNγ and/or IL-2 expression in response to all measured Env peptide pools. Regimens are ordered horizontally by decreasing median IgG V1V2 heterologous breadth score. Gray cells indicate responses not tested in the corresponding regimen. V1V2 antigens in the IgG/IgG3 panel are ordered vertically by phylogenetic tree of the corresponding V1V2 gp70 sequences (shown on the left with branches color-coded by clade). A total of 32 V1V2 antigens were tested across all regimens, including both the tag and gp70-scaffolded forms of the two antigens 1086 and its N156Q/293F mutated version. Since the two forms have identical sequences, they are represented only once in the phylogenetic tree, for a total of 30 branches. Row bars on the left are color coded by response: dark green for CD4+ T-cells, light green for CD8+ T-cells, dark blue for IgG, and light blue for IgG3. Because some of the V1V2 antigens were tested for IgG only, some of the tree branches point to a single row, while others correspond to two rows in the heatmap (antigens for which both IgG and IgG3 responses were tested).
Figure 2.
Figure 2.
(A, B) Distributions of binding antibody V1V2 heterologous breadth scores in each regimen and (C, D) pairwise comparisons between regimens of binding antibody V1V2 heterologous breadth score distributions. The box plots show the distribution of (A) IgG and (B) IgG3 binding antibody V1V2 heterologous breadth scores across participants in a given regimen, where each dot represents one participant. The horizontal line in each box represents the median regimen-specific breadth score. The number of participants (n) in each regimen is provided in the top row. Within a given regimen, the V1V2 heterologous breadth score was defined as the geometric mean of the binding antibody responses to the 3 heterologous V1V2 antigens with the highest median responses among all participants in that regimen. The tile plots display the difference in medians for each regimen pair in the (C) IgG and (D) IgG3 binding antibody V1V2 heterologous breadth score with asterisks denoting statistical significance: ** Wilcoxon test p-value < 0.001; * Wilcoxon test p-value < 0.05.
Figure 3.
Figure 3.
IgG binding antibody responses to gp70_B.CaseA V1V2 by trial and comparisons between arms across trials: (A) response rates, (B) response magnitude distributions, (C) pairwise comparison between regimens of response rates, (D) pairwise comparison between regimens of response magnitude distributions. The box plot in (B) shows the distribution of IgG binding antibody response magnitudes to gp70_B.CaseA V1V2 across participants in a given regimen, where each dot represents one participant. The horizontal line in each box represents the median regimen-specific IgG gp70_B.CaseA V1V2 response magnitude. The number of participants (n) in each regimen is provided in the top row (Total). The tile plots in (C) and (D) display the difference for each regimen pair in (C) response rate and (D) median response magnitude, with asterisks denoting statistical significance. In (C): ** indicates Barnard’s test p-value < 0.001, * indicates p-value < 0.05 (D) magnitude comparison between arms across trials. In (D): ** indicates Wilcoxon test p-value < 0.001, * indicates p-value < 0.05.
Figure 4.
Figure 4.
CD4+ T cell IFN-γ and/or IL-2 expression in response to Any Env by trial: (A) response rates, (B) response magnitudes, (C) pairwise comparison between regimens of response rates, (D) pairwise comparison between regimens of response magnitude distributions. The box plot in (B) shows the distribution of % CD4+ T cells expressing IFN-γ and/or IL-2 in response to Any Env across participants in a given regimen, where each dot represents one participant. The horizontal line in each box represents the median regimen-specific % CD4+ T cells expressing IFN-γ and/or IL-2 in response to Any Env. The number of participants (n) in each regimen is provided in the top row (Total). The tile plots in (C) and (D) display the difference for each regimen pair in (C) response rate and (D) median response magnitude, with asterisks denoting statistical significance. In (C): ** indicates Barnard’s test p-value < 0.001, * indicates p-value < 0.05. In (D): ** indicates Wilcoxon test p-value < 0.001, * indicates p-value < 0.05.

Similar articles

References

    1. Rerks-Ngarm S, Pitisuttithum P, Nitayaphan S, et al. . Vaccination with ALVAC and AIDSVAX to prevent HIV-1 infection in Thailand. N Engl J Med. 2009 Dec 3;361(23):2209–2220. doi:10.1056/NEJMoa0908492 - DOI - PubMed
    1. Haynes BF, Gilbert PB, McElrath MJ, et al. . Immune-correlates analysis of an HIV-1 vaccine efficacy trial. N Engl J Med. 2012 Apr 5;366(14):1275–1286. doi:10.1056/NEJMoa1113425 - DOI - PMC - PubMed
    1. Gottardo R, Bailer RT, Korber BT, et al. . Plasma IgG to linear epitopes in the V2 and V3 regions of HIV-1 gp120 correlate with a reduced risk of infection in the RV144 vaccine efficacy trial. PLoS One. 2013;8(9):e75665. doi:10.1371/journal.pone.0075665 - DOI - PMC - PubMed
    1. Zolla-Pazner S, deCamp A, Gilbert PB, et al. . Vaccine-induced IgG antibodies to V1V2 regions of multiple HIV-1 subtypes correlate with decreased risk of HIV-1 infection. PLoS One. 2014;9(2):e87572. doi:10.1371/journal.pone.0087572 - DOI - PMC - PubMed
    1. Yates NL, Liao HX, Fong Y, et al. . Vaccine-induced Env V1-V2 IgG3 correlates with lower HIV-1 infection risk and declines soon after vaccination. Sci Transl Med. 2014 Mar 19;6(228):228ra39. doi:10.1126/scitranslmed.3007730 - DOI - PMC - PubMed

MeSH terms

Associated data