. 2025 Apr 5:8:0648.
doi: 10.34133/research.0648. eCollection 2025.

Adaptive Whole-Brain Dynamics Predictive Method: Relevancy to Mental Disorders

Affiliations

Adaptive Whole-Brain Dynamics Predictive Method: Relevancy to Mental Disorders

Qian-Yun Zhang et al. Research (Wash D C). .

Abstract

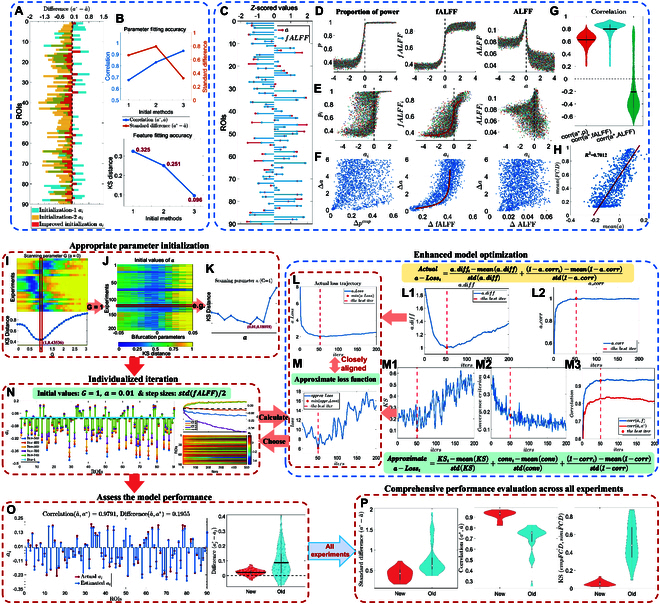
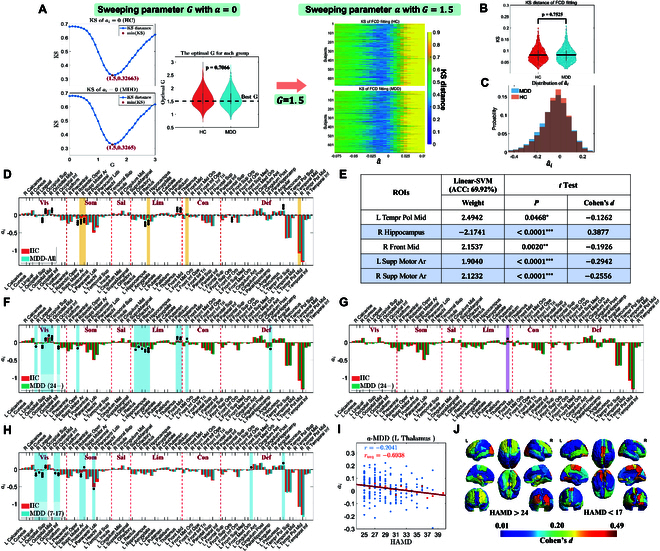
The Hopf whole-brain model, based on structural connectivity, overcomes limitations of traditional structural or functional connectivity-focused methods by incorporating heterogeneity parameters, quantifying dynamic brain characteristics in healthy and diseased states. Traditional parameter fitting techniques lack precision, restricting broader use. To address this, we validated parameter fitting methods using simulated networks and synthetic models, introducing improvements such as individual-specific initialization and optimized gradient descent, which reduced individual data loss. We also developed an approximate loss function and gradient adjustment mechanism, enhancing parameter fitting accuracy and stability. Applying this refined method to datasets for major depressive disorder (MDD) and autism spectrum disorder (ASD), we identified differences in brain regions between patients and healthy controls, explaining related anomalies. This rigorous validation is crucial for clinical application, paving the way for precise neuropathological identification and novel treatments in neuropsychiatric research, demonstrating substantial potential in clinical neurology.


Conflict of interest statement

Competing interests: The authors declare that they have no competing interests.

Figures

Fig. 1.
Fig. 1.
Comprehensive structure of the synthetic model-inspired adaptive whole-brain dynamic prediction method and its application in mental disorders. (A) Model fitting process, where features are extracted from the data to establish a whole-brain network model with nodes that are coupled but have heterogeneous dynamic parameters. Individualized model construction and data reconstruction are achieved through personalized parameter fitting. (B) Significant improvement in fitting performance achieved through the refinement and validation of multiple simulated networks, which include real brain network structures, BA networks, and WS networks with different rewiring probabilities, along with thousands of sets of baseline parameters. Once validated, the process is applied to real data (C). Parameters are fitted for different subjects, and statistical analyses compare parameter differences among groups, expanding the model’s application such as finding the potential biomarkers for mental disorders.
Fig. 2.
Fig. 2.
(A) Differences between fitted a^i and actual ai using 3 initialization methods. (B) Comparison of parameter fitting performance. (C) Relationship between Z-score normalized fALFF and a. (D) Simulations without coupling. (E) Simulations with coupling: relationship between a, p, fALFF, and ALFF. (F) Relationship between Δa and Δp, ΔfALFF, and ΔALFF, where Δ=maxmin. (G) Overall correlation comparison [corr(a, fALFF) is highest]. (H) Positive correlation between FCD mean values and a. (I to P) Steps of the synthetic model-inspired adaptive parameter fitting method: (I) Optimal G values (setting a = 0), with average G = 1 as the coupling strength. (J) Optimal homogeneous a^ values (G = 1). (K to O) Sample updated via individualized gradient descent. (L) Actual loss function during iterations (minimum at the 53rd iteration), including (L1) difference and (L2) similarity parts. (M) Approximate loss function (minimum at the 52nd iteration), with KS distance (M1), gradient convergence (M2), and similarity (M3). (N) Node variation during iterations, with details of the entire process and individual node updates. (O) Fitting performance of the example. (P) Comparison of all experiments: differences, correlations, and KS distance.
Fig. 3.
Fig. 3.
The fitting performance of the adaptive Hopf whole-brain model parameter fitting method across frequency bands is as follows: (A) TR = 2s (Nyquist frequency = 0.25Hz), displaying the fitting performance for fluctuation proportions across different bands relative to the 0.01 to 0.25Hz band. (B) TR = 1s (Nyquist frequency = 0.5Hz), illustrating the fitting outcomes for fluctuation proportions relative to the 0.01 to 0.5Hz band. The left, middle, and right graphs respectively show the fitting goodness (KS value) of the FCD matrix, the fitting differences, and the correlation of parameter a^.
Fig. 4.
Fig. 4.
(A) Initial value selection: a is set to 0, followed by parameter scanning to determine the optimal global coupling parameter (G=1.5) and homogeneous a^ for each subject [HC (648) and MDD (666)]. (B) Fitting performance (KS distance) of heterogeneous a^i shows no significant difference between groups (t test, P=0.7525), ensuring unbiased subsequent analyses. (C) Distribution of heterogeneous a^i parameters across groups. (D) Average bifurcation parameters a^i for each ROI in the HC and MDD groups. Asterisks indicate significant differences (t test: P<0.05, Cohen’s d>0.25), with significance levels denoted as (0.01<P<0.05), (0.01<P<0.001), and (P<0.001). Shaded regions highlight the top 5 ROIs with the highest linear-SVM weights. (E) Classifier weights for key ROIs with t test statistics, where shaded areas indicate significant weights and statistical differences. (F to J) Relationships between a^i and HAMD scores: (F) t test results showing significant differences between severe MDDs and HCs after FDR correction; (G) associations between HAMD scores and a^i in severe MDDs (LMM, FDR-corrected); (H) significant t test differences between mild MDDs and HCs after FDR correction; (I) variation of a^i in the left thalamus with HAMD scores (entire dataset: r=0.2041, averaged data: ravg=0.6938); (J) visually compares Cohen’s d effect sizes for differences between MDD and HC groups.
Fig. 5.
Fig. 5.
(A) The distribution of FCD matrices from BOLD data reveals minor differences between HC(412) and ASD(332) groups. (B) No significant difference is observed in the final fitting performance (KS distance) of heterogeneous a^i between the 2 groups (t test, P=0.6995), with all average KS values below 0.1. (C) Distribution of a^i across both groups. (D) ROIs marked with asterisks show statistically significant differences and a medium effect size (t test: P<0.05, Cohen’s d>0.25). Shaded areas highlight the top 10 ROIs with the highest linear-SVM weights. (E) Weights of key classifier nodes and corresponding t test results, with shaded areas denoting ROIs of substantial classifier weights and statistical significance. (F) LMM results show significant associations between ADOS-Social score and a^i after FDR correction. (G) t Test results reveal significant differences between ASDs and HCs after FDR correction. (H) Variation in a^i values in the right SPG as scores change (entire dataset: r=0.2602; averaged data at each score point: ravg=0.8471) (0.01<P<0.05:, 0.01<P<0.001:, P<0.001:). (I) Effect size (Cohen’s d) visually compares differences between ASDs and HCs.

References

    1. Horwitz B, Tagamets MA, McIntosh AR. Neural modeling, functional brain imaging, and cognition. Trends Cogn Sci. 1999;3(3):91–98. - PubMed
    1. Honey CJ, Sporns O, Cammoun L, Gigandet X, Hagmann P. Predicting human resting state functional correlation from structural correlation. Proc Natl Acad Sci USA. 2009;106(6):2035–2040. - PMC - PubMed
    1. Deco G, Jirsa V, McIntosh AR, Sporns O, Kötter R. Key role of coupling, delay, and noise in resting brain fluctuations. Proc Natl Acad Sci USA. 2009;106(25):10302–10307. - PMC - PubMed
    1. Jirsa VK, Jantzen KJ, Fuchs A, Kelso JS. Spatiotemporal forward solution of the EEG and MEG using network modeling. IEEE Trans Med Imaging. 2002;21(5):493–504. - PubMed
    1. Ritter P, Schirner M, Mcintosh AR, Jirsa VK. The virtual brain integrates computational modeling and multimodal neuroimaging. Brain Connect. 2013;3(2):121–145. - PMC - PubMed

LinkOut - more resources