. 2025;35(3):75.
doi: 10.1007/s11222-025-10606-w. Epub 2025 Apr 3.

Online Bayesian changepoint detection for network Poisson processes with community structure

Affiliations

Online Bayesian changepoint detection for network Poisson processes with community structure

Joshua Corneck et al. Stat Comput. 2025.

Abstract

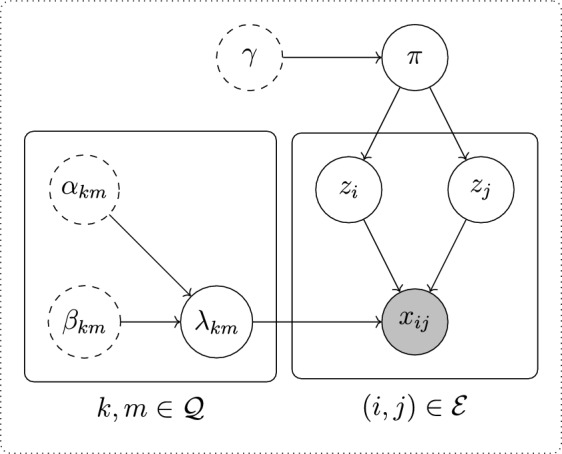
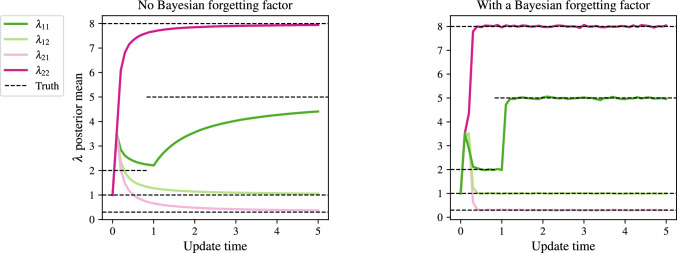
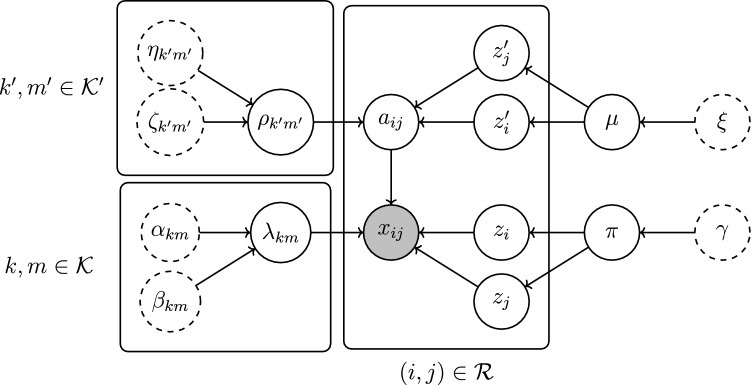
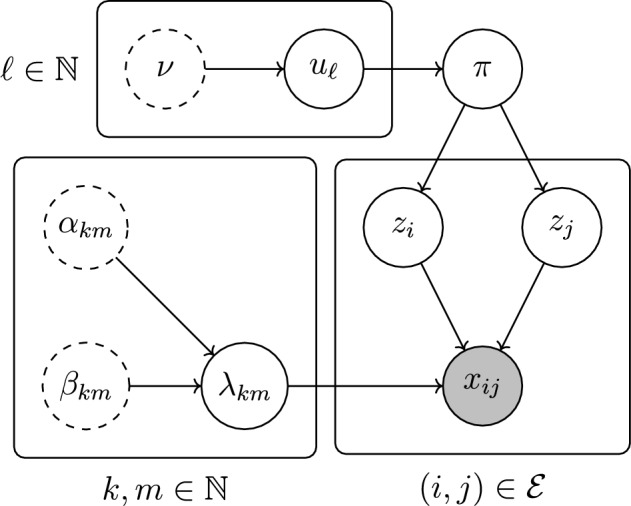
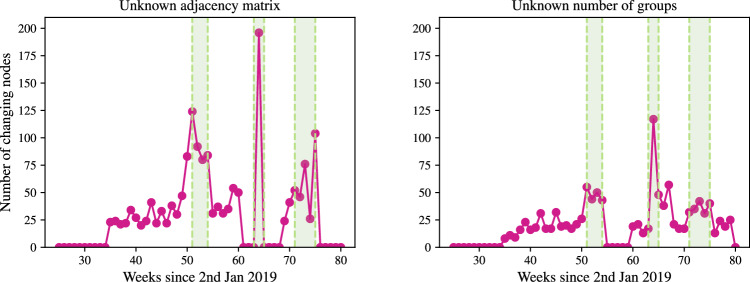
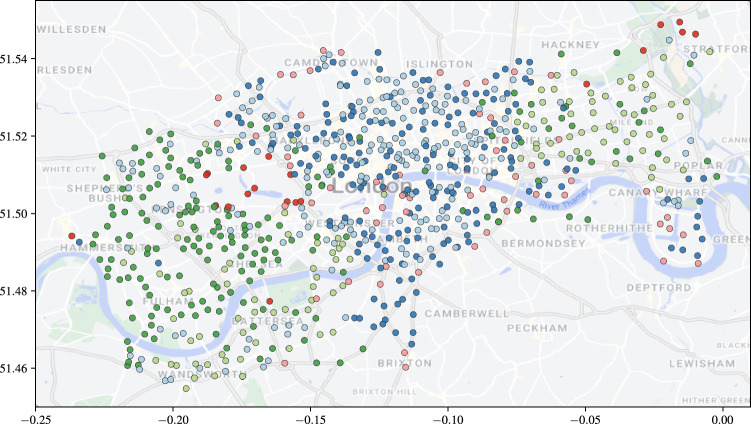
Network point processes often exhibit latent structure that govern the behaviour of the sub-processes. It is not always reasonable to assume that this latent structure is static, and detecting when and how this driving structure changes is often of interest. In this paper, we introduce a novel online methodology for detecting changes within the latent structure of a network point process. We focus on block-homogeneous Poisson processes, where latent node memberships determine the rates of the edge processes. We propose a scalable variational procedure which can be applied on large networks in an online fashion via a Bayesian forgetting factor applied to sequential variational approximations to the posterior distribution. The proposed framework is tested on simulated and real-world data, and it rapidly and accurately detects changes to the latent edge process rates, and to the latent node group memberships, both in an online manner. In particular, in an application on the Santander Cycles bike-sharing network in central London, we detect changes within the network related to holiday periods and lockdown restrictions between 2019 and 2020.

Keywords: Network point process; Online variational inference; Stochastic block model; Streaming data.


Figures

Fig. 1
Fig. 1
A directed acyclic graphical model representation of the model in Eqs. (1)–(3)
Fig. 2
Fig. 2
Illustration of the setup in Sect. 2.1 for a network with N=3 and E={(1,3),(2,1),(2,3)}. Circles represent event times, coloured according to their edge. Arrival times to each edge are collated into Dr
Fig. 3
Fig. 3
A representation of the transformation of the CAVI approximation from the r-th time step via temperature parameters δ and its use as a prior for the (r+1)-th time step. The overlaying of Dr on the diagonal arrows indicates that the transformed CAVI posterior is combined with incoming data to yield the next approximate posterior
Fig. 4
Fig. 4
Estimated posterior mean of λR+K×K for a fully connected graph with N=500 nodes simulated on [0, 5], with K=2 groups, Π=(0.6,0.4), λ22=8,λ12=1,λ21=0.3, and λ11=2. At t=1, λ11 changes to 5. The four coloured lines are the posterior means of the components λ, plotted against time step. The black dashed horizontal lines are the true values of λ at each time point. δ=0.1 in the right-hand panel
Fig. 5
Fig. 5
An illustration of how Xkmr is updated for a stream with an outlier at r=7
Fig. 6
Fig. 6
Illustration of the behaviour of the KL-divergence with different lags for a changepoint and an outlier
Fig. 7
Fig. 7
A directed acyclic graphical model representation of the model in (17)–(19)
Fig. 8
Fig. 8
A directed acyclic graph of the model given by (23)–(24)
Fig. 9
Fig. 9
Detection of group membership changes for a varying percentage of nodes swapping from group 1 to group 2 at t=3. The panel titles give the percentage of nodes that swap from group 1 to 2
Fig. 10
Fig. 10
Mean ARI against update time for the merger of group 2 into 1 at t=2.5, and the creation of group 2 at t=3.5, with the panel titles giving the percentage of nodes remaining in group 1 after t=3.5. The black, dashed vertical lines mark the changepoints. At t=2.5, all nodes in group 2 change to group 1, and at t=3.5, P% of group 1 nodes change to group 2, P{1,10,25,50,75,95}
Fig. 11
Fig. 11
Posterior means and 95% simulation interval for components λ with update time. The black, dashed vertical lines mark the changepoints. At t=2.5, all nodes in group 2 change to group 1, and at t=3.5, P% of group 1 nodes change to group 2, P{10,75,95}
Fig. 12
Fig. 12
Boxplots of CCD and DNF over 50 runs for no BFF and a BFF of δ=0.1. Each simulation has one change at t=3 and another a t=3+0.1M, where M is on the horizontal axis
Fig. 13
Fig. 13
Posterior means and 95% simulation interval for components λ with update time. The black, dashed vertical lines mark the changepoints. Each simulation has one change at t=3 and another a t=3+0.1M, where M is the number of time steps in the column caption
Fig. 14
Fig. 14
Posterior means and 95% simulation interval for components λ with update time. The black, dashed vertical line marks the changepoint, at which 25% of nodes in group 1 swap to group 2
Fig. 15
Fig. 15
Mean ARI of the repetitions against update time. The black, dashed vertical line marks the changepoint, at which 25% of nodes in group 1 swap to group 2
Fig. 16
Fig. 16
Left-panel: posterior means and 95% simulation interval for the components λ with update time. The black, dotted lines are the true underlying rates. Right-panel: ARI with update time. The black, dashed vertical line marks the changepoint
Fig. 17
Fig. 17
The number of nodes that change memberships at each update point from initialisation. The green regions correspond to the Christmas and New Year period of 2019, the introduction of the first UK COVID-19 lockdown, and the phased easing of these restrictions, respectively
Fig. 18
Fig. 18
Station locations with those stations that change group at the onset of the UK COVID-19 lockdown coloured dark red
Fig. 19
Fig. 19
Station locations coloured by assigned group at update time step 50 of the dynamic BHPP with an unknown number of groups and A=1791×791

References

    1. Airoldi, E.M., Costa, T.B., Chan, S.H.: Stochastic blockmodel approximation of a graphon: theory and consistent estimation. In: Burges, C.J., Bottou, L., Welling, M., Ghahramani, Z., Weinberger, K.Q. (eds.) Advances in Neural Information Processing Systems, vol. 26. Curran Associates Inc., New York (2013)
    1. Alanqary, A., Alomar, A.O., Shah, D.: Change point detection via multivariate singular spectrum analysis. In: Beygelzimer, A., Dauphin, Y., Liang, P., Vaughan, J.W. (eds.) Advances in Neural Information Processing Systems (2021). https://openreview.net/forum?id=i0DmV60aeK
    1. Amini, A.A., Chen, A., Bickel, P.J., Levina, E.: Pseudo-likelihood methods for community detection in large sparse networks. Ann. Stat. 41(4), 2097–2122 (2013)
    1. Bifet, A., Gavaldà, R., Holmes, G., Pfahringer, B.: Machine learning for data streams: with practical examples in MOA. In: Adaptive Computation and Machine Learning series. MIT Press (2018)
    1. Bishop, C.M.: Pattern Recognition and Machine Learning (Information Science and Statistics). Springer, Berlin (2006)

LinkOut - more resources