. 2025 Mar 21:16:1501704.
doi: 10.3389/fimmu.2025.1501704. eCollection 2025.

Enhanced and long-lasting SARS-CoV-2 immune memory in individuals with common cold coronavirus cross-reactive T cell immunity

Affiliations

Enhanced and long-lasting SARS-CoV-2 immune memory in individuals with common cold coronavirus cross-reactive T cell immunity

David M Florian et al. Front Immunol. .

Abstract

With the continuous emergence of novel SARS-CoV-2 variants, long-lasting and broadly reactive cellular and humoral immunity is critical for durable protection from COVID-19. We investigated SARS-CoV-2-specific T cell immunity in relation to antibodies, infection outcome and disease severity and assessed its durability in a longitudinal cohort over a three-year time course. We identified pre-existing T cells reactive to the seasonal coronavirus (CoV) OC43 that cross-react with the conserved SARS-CoV-2 spike S813-829 peptide. These cross-reactive T cells increased in frequency following SARS-CoV-2 infection or vaccination and correlated with enhanced spike-specific T cell responses and significantly reduced viral loads. Furthermore, our data revealed that CoV-cross-reactive T cells were maintained as part of the long-lasting memory response, contributing to increased T cell frequencies against omicron variants. These findings suggest a functional role of CoV-cross-reactive T cells that extends beyond the initial SARS-CoV-2 exposure, contributing to enhanced immunity against highly mutated SARS-CoV-2 variants.

Keywords: CD4 T cell response; SARS-CoV-2; cell-mediated immunity; long term immunity; mRNA vaccination.


Conflict of interest statement

The authors declare that the research was conducted in the absence of any commercial or financial relationships that could be construed as a potential conflict of interest.

Figures

Figure 1
Figure 1
SARS-CoV-2 T cell responses to spike SI and SII in patients and SARS-CoV-2 naïve individuals after BNT162b2 vaccination. (A) Timeline of the study indicating blood sample collection points following vaccination and infection. Created with BioRender.com. (B, C) Ex vivo interleukin (IL)-2 ELISpot results after stimulation of PBMCs with SI and SII peptide pools covering the ancestral SARS-CoV-2 spike in pre-pandemic unexposed donors (n=18), COVID-19 patients (n=72) and BNT162b2 vaccinated individuals (n=44). (D) Neutralizing antibody titers, as determined by life-virus neutralization assays. Titers below the limit of detection (<10) were set to 5. The horizontal lines indicate median, with error bars illustrating the interquartile range (IQR). (E-G) Correlation between IL-2+ T cell responses to SARS-CoV-2 SI and SII peptide pools and neutralizing antibody titers after infection (T1) (E) or first (T0) (F) and second (T1) vaccination (G). Each symbol represents one donor. The p-values represent the results of unpaired t-tests (B-D) and Spearman correlation (E-G). Dotted lines indicate 15 SFU/106 PBMCs. SFU, spot forming units.
Figure 2
Figure 2
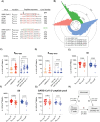
SARS-CoV-2 T cell responses to cross-reactive peptides in patients and vaccinated individuals. (A) Sequence identity of common cold coronavirus peptide homologs and SARS-CoV-2-derived peptides in spike S2. Predicted core sequences for HLA-DP4 (black) and HLA-DR15 (green) are indicated by squares. Created with BioRender.com. (B) The circular bar plot illustrates the frequency of different HLA-DP, -DR and -DQ alleles (n=222) present in the study population. HLA alleles present at frequencies ≥10% in the study cohort with strong binding affinity for epitopes S813-829 and S1002-1018 (NetMHCpan% ranks<2) are indicated. (C) Ex vivo IL-2 ELISpot results after stimulation of PBMCs with spike S813-829 in HLA-matched pre-pandemic donors (n=16), patients (n=55) and vaccinated individuals (n=31). (D) Ex vivo interleukin (IL)-2 ELISpot results after stimulation of PBMCs with spike S1002-1018 in HLA-matched unexposed donors (n=9), patients (n=19) and vaccinated individuals (n=17). (E-G) Ex vivo IL-2 ELISpot results after stimulation of PBMCs with spike SI and SII peptide pools and a pool of non-cross-reactive spike peptides (SARS-CoV-2* peptide pool) in HLA-matched patients (n=55) and vaccinees (n=31) with or without S813-829 responses. Each symbol represents one donor. The horizontal lines indicate medians, with error bars illustrating the interquartile range (IQR). The p-values represent the results of unpaired t-tests and one-way ANOVA. Dotted lines indicate 15 SFU/106 PBMCs. SFU, spot forming units. (H) Structural equation model illustrating the relationship between S813-829-specific T cells, viral load and severe COVID-19. Path A: Multiple regression analysis of S813-829-reactive T cells and virus RNA load (standardized regression coefficient ß=-0.877, p=0.004). Path B: The effect of virus RNA load on disease severity (hospitalized vs. non-hospitalized; standardized regression coefficient ß=0.120, p=0.021). Path C: Effect of S813-829-specific T cells on severe COVID-19 (standardized regression coefficient ß=0.024, p=0.808). Regression analyses included age as a covariate.
Figure 3
Figure 3
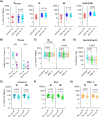
Durability and cross-reactivity of spike-specific T cells in individuals 3 years after first SARS-CoV-2 exposure. (A) Ex vivo interleukin (IL)-2 ELISpot results after stimulation of PBMCs with spike S813-829, SI and SII peptide pools in HLA-matched individuals at 6 months post-infection (post inf T2; n=13), and 1 year (post vac T2; n=21) and 3 years (post vac T3; n=21) post 2nd vaccination, respectively. Each symbol represents one donor. (B) PBMCs obtained 3 years post 2nd vaccination were propagated for 10 days with S813-829, followed by flow cytometric analysis after restimulation with indicated peptides. Graphs show frequencies of IL-2, IFN-γ and TNF-α-positive cells within CD4 (left panel) and CD8 (right panel) (n=9; shown for S813-829 R+). (C) Ex vivo IL-2 ELISpot results after stimulation with spike SI and SII peptide pools covering the ancestral and omicron variants BA.5 and XBB.1.5 in HLA-matched individuals 3 years post-vaccination. (D) Serum neutralization titers against ancestral and omicron BA.5 and XBB.1.5 variants at 3 years post-vaccination. (E-G) Ex vivo IL-2 ELISpot results after stimulation of PBMCs with spike SI and SII peptide pools covering the ancestral or omicron BA.5 and XBB.1.5 variants in HLA-matched donors (n=21) with or without S813-829 responses (S813-829 R+ and S813-829 R-, respectively). The horizontal lines indicate medians, with error bars illustrating the interquartile range (IQR). The p-values represent the results of unpaired t-tests (A, E-G), and Dunn´s multiple comparisons tests (C,D). Dotted lines indicate 15 SFU/106 PBMCs. SFU, spot forming units.

References

    1. Kundu R, Narean JS, Wang L, Fenn J, Pillay T, Fernandez ND, et al. . Cross-reactive memory T cells associate with protection against SARS-CoV-2 infection in COVID-19 contacts. Nat Commun. (2022) 13:80. doi: 10.1038/s41467-021-27674-x - DOI - PMC - PubMed
    1. Swadling L, Diniz MO, Schmidt NM, Amin OE, Chandran A, Shaw E, et al. . Pre-existing polymerase-specific T cells expand in abortive seronegative SARS-CoV-2. Nature. (2022) 601:110–7. doi: 10.1038/s41586-021-04186-8 - DOI - PMC - PubMed
    1. Loyal L, Braun J, Henze L, Kruse B, Dingeldey M, Reimer U, et al. . Cross-reactive CD4(+) T cells enhance SARS-CoV-2 immune responses upon infection and vaccination. Science. (2021) 374:eabh1823. doi: 10.1126/science.abh1823 - DOI - PMC - PubMed
    1. Chandran A, Rosenheim J, Nageswaran G, Swadling L, Pollara G, Gupta RK, et al. . Rapid synchronous type 1 IFN and virus-specific T cell responses characterize first wave non-severe SARS-CoV-2 infections. Cell Rep Med. (2022) 3:100557. doi: 10.1016/j.xcrm.2022.100557 - DOI - PMC - PubMed
    1. Tan AT, Linster M, Tan CW, Le Bert N, Chia WN, Kunasegaran K, et al. . Early induction of functional SARS-CoV-2-specific T cells associates with rapid viral clearance and mild disease in COVID-19 patients. Cell Rep. (2021) 34:108728. doi: 10.1016/j.celrep.2021.108728 - DOI - PMC - PubMed

Substances