. 2025 Mar 21:12:1537221.
doi: 10.3389/fnut.2025.1537221. eCollection 2025.

Chloride channel-3 regulates sodium-iodide symporter expression and localization in the thyroids of mice on a high-iodide diet

Affiliations

Chloride channel-3 regulates sodium-iodide symporter expression and localization in the thyroids of mice on a high-iodide diet

Meisheng Yu et al. Front Nutr. .

Abstract

Introduction: Certain chloride channels and H+/Cl- antiporters, such as chloride channel 3 (ClC-3), are expressed at the apical pole of thyrocytes, facilitating iodide (I-) efflux. However, the relationship between ClC-3 and I- uptake remains unclear. Additionally, whether ClC-3 and reactive oxygen species (ROS) regulate sodium-iodide symporter (NIS) expression and localization under excessive I- conditions remain underexplored.

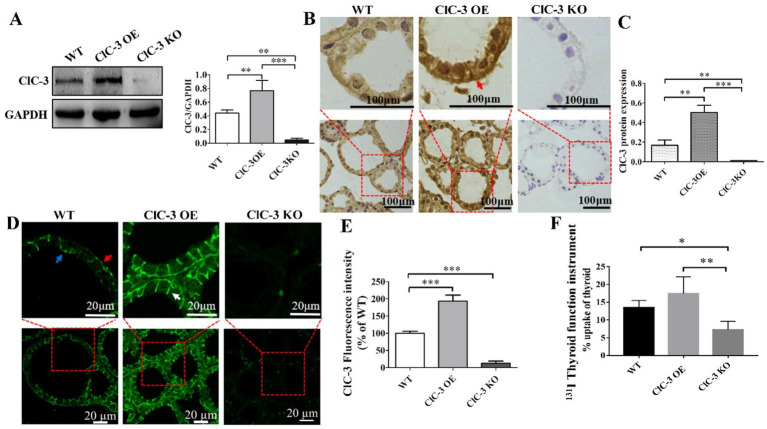
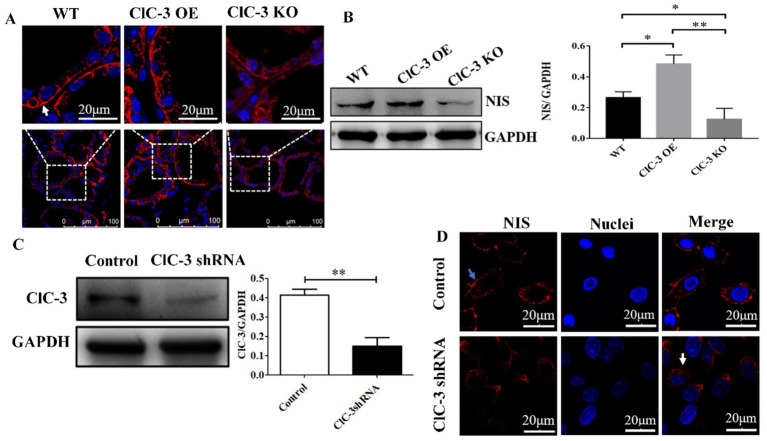
Methods: The expression and localization of ClC-3 in wild-type (WT), ClC-3 overexpression (OE) and ClC-3 knockout (KO) were detected by Western blotting (WB), immunohistochemistry and immunofluorescence, respectively. The 131I uptake of the thyroid was measured by thyroid function instrument. The expression and localization of NIS in normal and high iodide diet were detected, respectively. The role of ROS in the regulation of NIS by ClC-3 was observed.

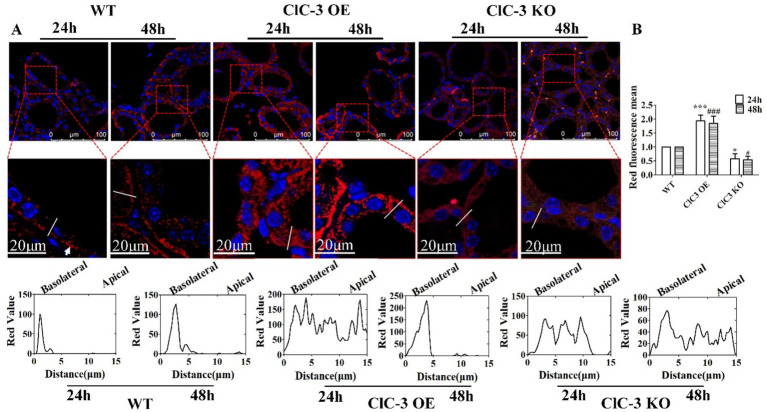
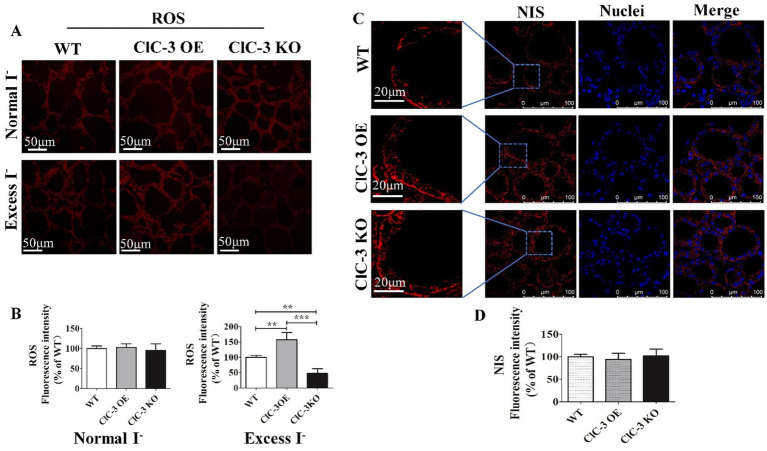
Results: ClC-3 expressions in thyrocytes were primarily localized to the basolateral and lateral membranes, in both ClC-3 OE and WT mice groups under normal I- conditions. I- uptake was significantly higher in WT and ClC-3 OE mice than in the ClC-3 KO mice under normal I- conditions. The ClC-3 OE group exhibited a higher number of thyroid follicles with elevated NIS expression in the basolateral and lateral membranes than the WT and KO groups. In the ClC-3 KO group, the NIS was predominantly localized in the cytoplasm. In the WT group, NIS fluorescence intensity at the basolateral and lateral membranes increased after 48 h of excessive iodide exposure compared to 24 h. In ClC-3 OE mice, NIS, initially localized intracellularly after 24 h of excessive iodide exposure, was almost fully reintegrated into the basolateral and lateral membranes after 48 h. In contrast, in ClC-3 KO mice, NIS remained primarily cytoplasmic, with no significant change between 24 h and 48 h of I- excess. ROS fluorescence intensity was significantly higher in the ClC-3 OE group than those in the WT and KO groups after 24 h of I- excess. Pre-inhibition of ROS showed no significant differences in NIS localization or expression among the three groups after 24 h of I- excess.

Discussion: These findings suggest that ClC-3 may regulate NIS function via ROS signaling under excessive iodide conditions.

Keywords: basolateral and lateral membranes; chloride channel 3; iodide conditions; iodide excess; reactive oxygen species; sodium-iodide symporter; thyroid gland.


Conflict of interest statement

The authors declare that the research was conducted in the absence of any commercial or financial relationships that could be construed as a potential conflict of interest.

Figures

Figure 1
Figure 1
ClC-3 expression influences 131I uptake in the thyroid. (A) ClC-3 and control (GAPDH) protein expressions detected via Western blotting in WT, ClC-3 OE, or ClC-3 KO mice. Representative western blot and histograms of densitometric analyses normalized for the relative GAPDH content. (B,C) Immunohistochemical analysis of ClC-3 expression and location in the thyroid tissues of mice in the three groups. The brown color indicates specific immunostaining of ClC-3. The positive signal was measured via ImageJ. Original magnification: 400× (B). (D,E) Thyroid sections from WT, ClC-3 OE, or ClC-3 KO mice fed a normal iodide diet were incubated with anti-ClC3 antibodies. Expression levels and distribution of ClC-3 were measured by immunofluorescence. Histogram analysis of the mean fluorescence intensity of ClC-3. (F) The percentage of 131I uptake in the thyroid was measured using a thyroid function instrument for WT, ClC-3 OE, and ClC-3 KO mice. Red arrows indicate ClC-3 staining on the basolateral side of the thyroid follicle, white arrows indicate ClC-3 staining on the lateral side, and blue arrows indicate ClC-3 staining on the apical side. All results are representative of three independent experiments. Data are presented as means ± SD (n = 6 for each group). *p < 0.05; **p < 0.01; ***p < 0.001. OE, overexpressing; KO, knockout; WT, wild-type.
Figure 2
Figure 2
NIS protein expression or localization in the thyroid glands of WT, ClC-3 OE, and ClC-3 KO mice fed with normal iodide. (A) Immunofluorescence analysis was performed using a rabbit polyclonal anti-NIS antibody and an anti-rabbit fluorescein-conjugated secondary antibody, Cy3 (red). Nuclei were stained with DAPI (blue). The antibody predominantly labeled the basolateral membrane in the follicles (indicated by white arrows). Thyroid slides were observed under a Zeiss LSM 880 confocal microscope with a 63× immersion lens. (B) NIS proteins from the thyroid glands were extracted for western blot analysis (n = 6 per group). (C) ClC-3 and GAPDH proteins detected by Western blotting 72 h after shRNA transfection. Quantified expression levels of ClC-3 relative to GAPDH. (D) NIS expression and distribution in the control and ClC-3 shRNA of FRTL-5 cell lines. Blue arrows point to the cytomembrane, and white arrows point to the cytoplasm. Representative data from three experiments are displayed, with at least six animals per group used in each experiment. Data are presented as mean ± SD. *p < 0.05, **p < 0.01. OE, overexpressing; KO, knockout; WT, wild-type; NIS, Na+/I symporter.
Figure 3
Figure 3
Immunofluorescence analysis of NIS expression and localization in WT, ClC-3 OE, and ClC-3 KO mice thyroid glands under excess I. (A) Representative images from confocal immunofluorescence microscopy illustrate NIS expression and distribution in the thyroid follicles of WT, ClC-3 OE, and ClC-3 KO mice (n = 6 per group) after excess iodide administration (150 μg/d NaI) for 24 or 48 h. The chart represents the analysis of NIS (red) fluorescence intensity across the white lines of 40 thyroid follicles in the three groups using ImageJ software. (B) Representative histogram images of total NIS fluorescence intensity detected by immunofluorescence after 24 h and 48 h under excess I. NIS is visualized in red, and nuclei are visualized in blue. The white arrows represent the basolateral membrane of the thyroid cells. *p < 0.05, ***p < 0.001, compared with the WT (24 h), #p < 0.05, ###p < 0.001, compared with the WT (48 h). Error bars represent the standard deviation. OE, overexpressing; KO, knockout; WT, wild-type; NIS, Na+/I symporter.
Figure 4
Figure 4
Effect of ROS on NIS expression and distribution in mice thyroid gland after 24 h under excess I. (A,B) Red fluorescence represents the ROS intensity for frozen sections of the thyroid from three groups under normal I and excess I administration. (C,D) After inhibiting ROS production, representative images of NIS distribution and expression in WT, ClC-3 OE, and ClC-3 KO mice after inhibiting ROS production for 24 h under excess I. The red fluorescence represents NIS, the blue fluorescence represents the nucleus, and the left column represents an enlarged view of a typical local region. Experiments were repeated three times with similar results. Data are presented as mean ± SD. **p < 0.01; ***p < 0.001. OE, overexpressing; KO, knockout; WT, wild-type; NIS, Na+/I symporter; ROS, reactive oxygen species.

Similar articles

References

    1. Alotaibi H, Tuzlakoğlu-Öztürk M, Tazebay UH. The thyroid Na+/I- symporter: molecular characterization and genomic regulation. Mol Imaging Radionucl Ther. (2017) 26:92–101. doi: 10.4274/2017.26.suppl.11, PMID: - DOI - PMC - PubMed
    1. Dark KV, Skinner OT, Kim DY, Karnia JJ, Mickelson MA, Maitz CA. Sodium iodide symporter immunolabelling as a predictor of clinical iodide uptake in canine thyroid carcinoma: a preliminary study. Vet Comp Oncol. (2024) 22:239–44. doi: 10.1111/vco.12971, PMID: - DOI - PubMed
    1. Ravera S, Nicola JP, Salazar-De Simone G, Sigworth FJ, Karakas E, Amzel LM, et al. . Structural insights into the mechanism of the sodium/iodide symporter. Nature. (2022) 612:795–801. doi: 10.1038/s41586-022-05530-2, PMID: - DOI - PMC - PubMed
    1. Suzuki K, Kimura H, Wu H, Kudo N, Kim WB, Suzuki S, et al. . Excess iodide decreases transcription of NIS and VEGF genes in rat FRTL-5 thyroid cells. Biochem Biophys Res Commun. (2010) 393:286–90. doi: 10.1016/j.bbrc.2010.01.123, PMID: - DOI - PMC - PubMed
    1. Fong P. Thyroid iodide efflux: a team effort? J Physiol. (2011) 589:5929–39. doi: 10.1113/jphysiol.2011.218594, PMID: - DOI - PMC - PubMed

LinkOut - more resources