. 2025 Jul;24(7):e70061.
doi: 10.1111/acel.70061. Epub 2025 Apr 7.

Aerobic Exercise Restores Hippocampal Neurogenesis and Cognitive Function by Decreasing Microglia Inflammasome Formation Through Irisin/NLRP3 Pathway

Affiliations

Aerobic Exercise Restores Hippocampal Neurogenesis and Cognitive Function by Decreasing Microglia Inflammasome Formation Through Irisin/NLRP3 Pathway

Renqing Zhao et al. Aging Cell. 2025 Jul.

Abstract

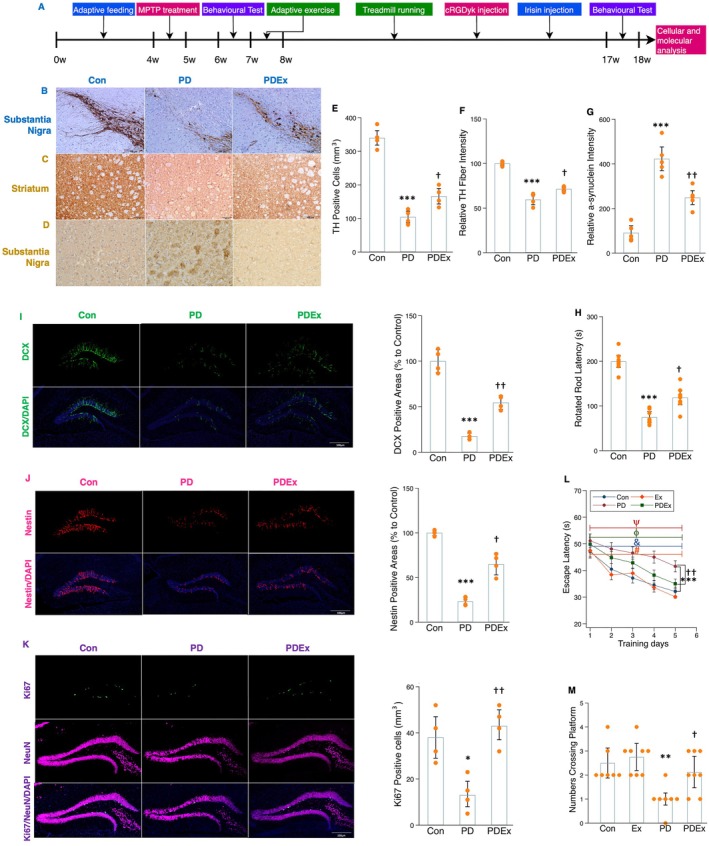
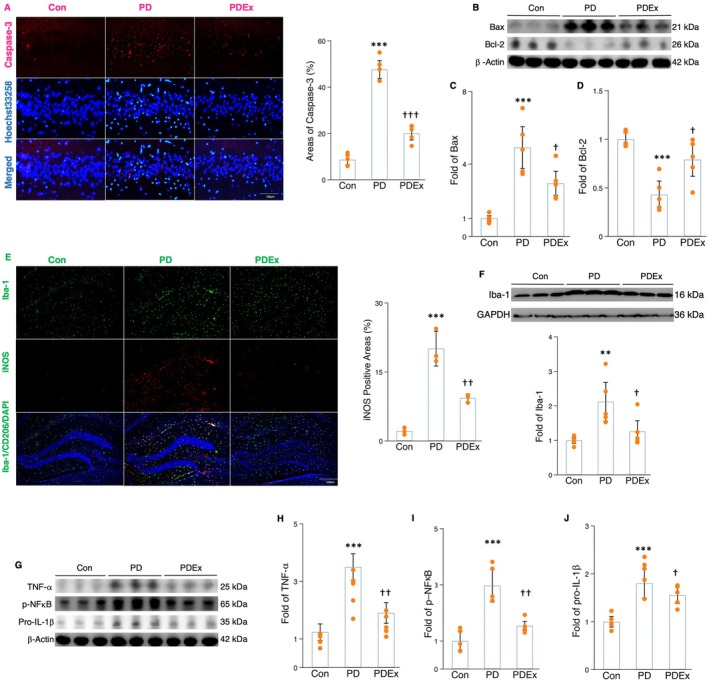
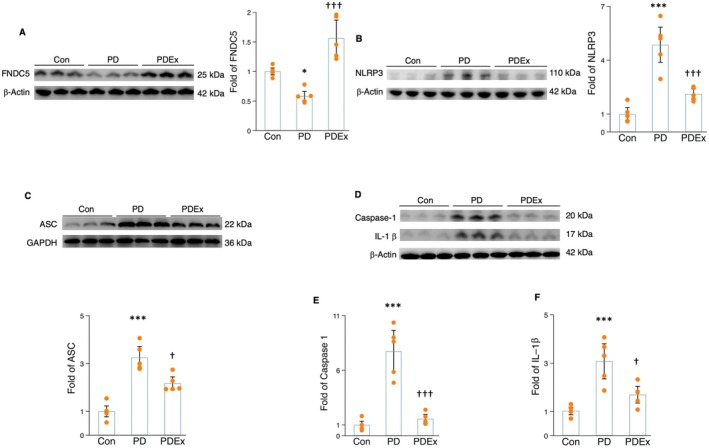
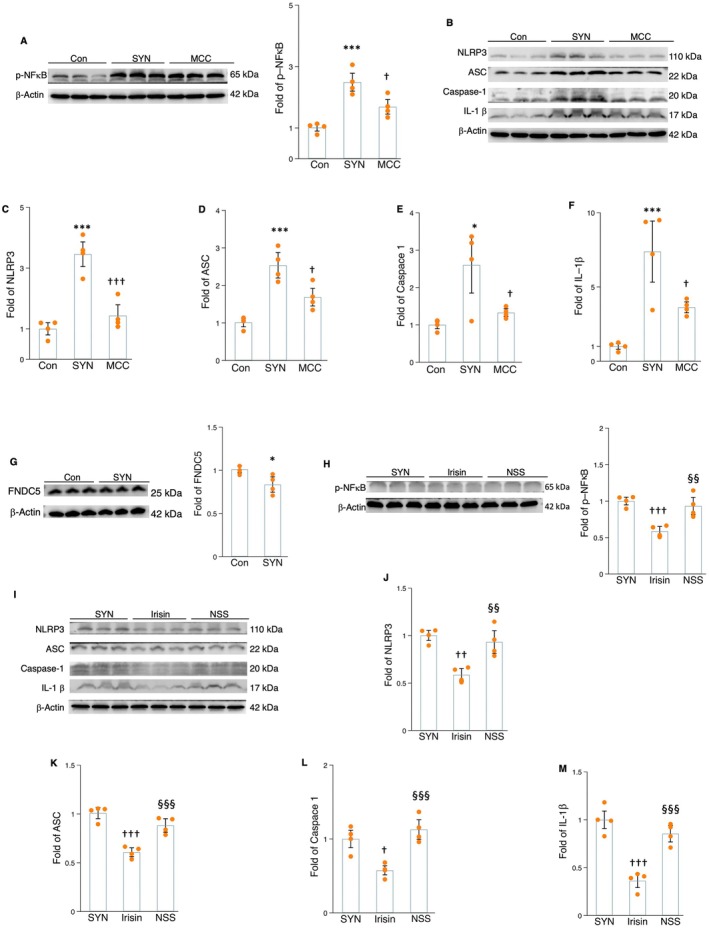
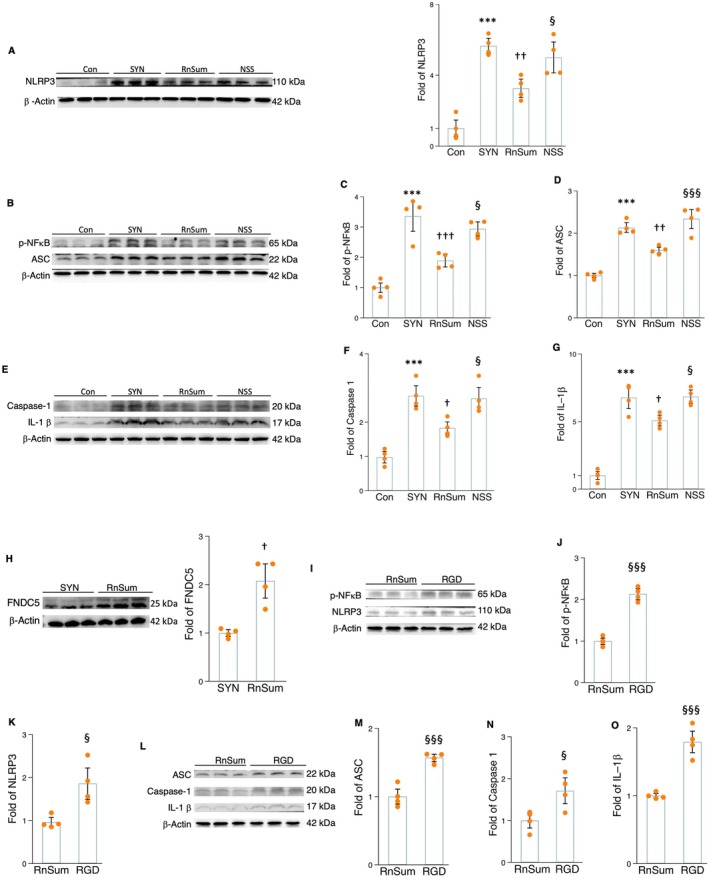
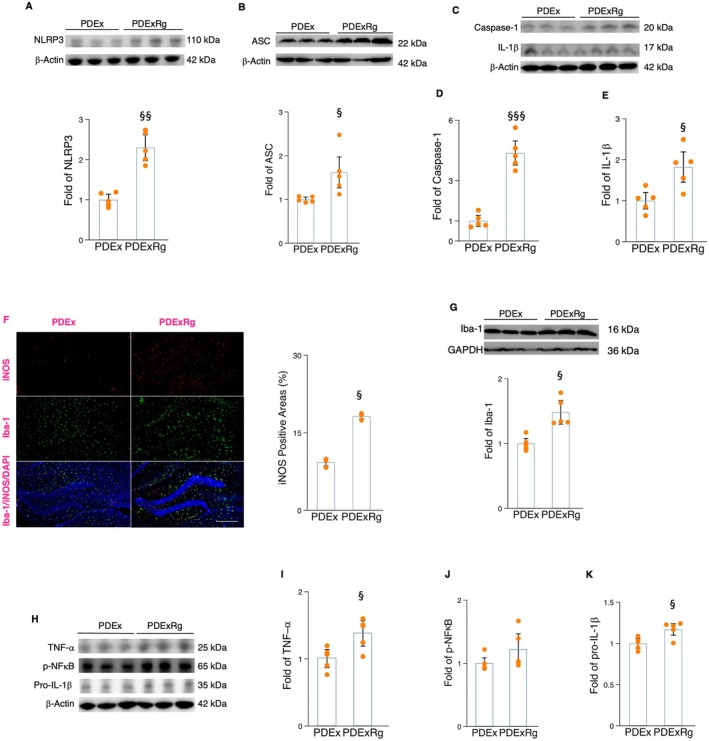
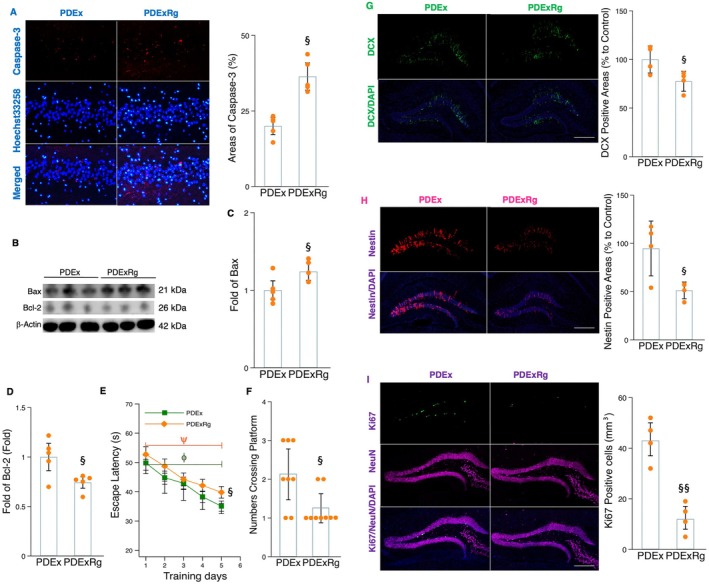
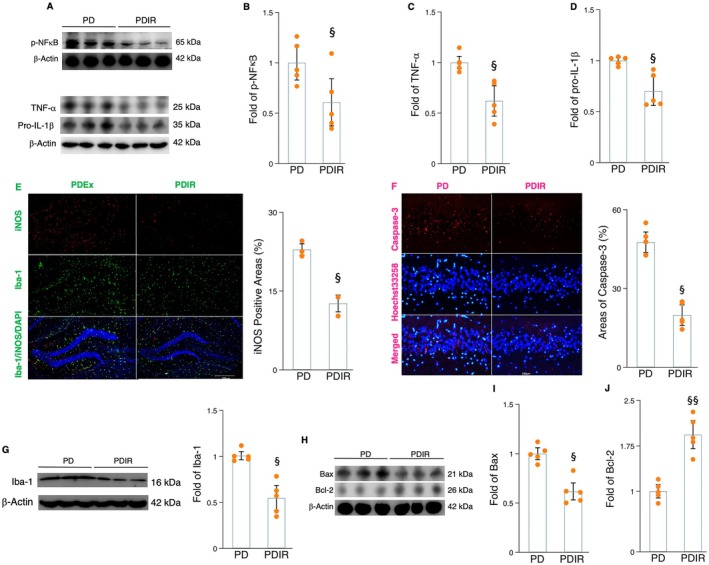
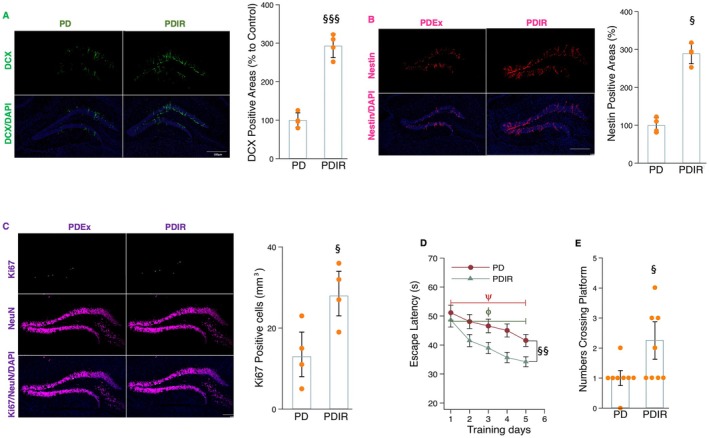
Persistent microglial inflammation is a detrimental contributor to the progression of Parkinson disease (PD) pathology and related issues such as impaired adult hippocampal neurogenesis (AHN) and cognition. We conducted a 10-week exercise program with MPTP-treated mice to determine whether neuroinflammation can be addressed by aerobic exercise and elucidate its underlying regulatory mechanisms. Ten weeks of exercise significantly reduced PD-related pathology and enhanced AHN and memory. These changes were linked to a reduction in neuronal apoptosis, microglial inflammation, and NLRP3 inflammasome activation. In cultured microglia, fibril α-synuclein reduced FNDC5/irisin protein levels and induced NLRP3 inflammasome formation and IL-1β production, which could be diminished by recombinant irisin treatment. Interestingly, "runner serum" isolated from exercising rodents enhanced FNDC5/irisin expression and reduced NLRP3 inflammasome components and IL-1β secretion in α-synuclein-treated microglia. These effects could be diminished by blocking irisin signaling with cyclo RGDyk or NLRP3 agonist, nigericin sodium salt. Exercise-induced neuroprotective effects were weakened by treatment of MPTP-treated mice with cyclo RGDyk. In contrast, systematic administration of irisin partially replicated the beneficial effects of exercise on PD pathology, AHN, and memory function. As a nonpharmacological strategy, aerobic exercise effectively addresses PD pathology and preserves adult neurogenesis and cognition by mitigating microglial inflammation via mediating irisin/NLRP3 inflammasome pathways.

Keywords: FNDC5/irisin; NLRP3 inflammasome; Parkinson disease; aerobic exercise; cognition; hippocampal neurogenesis.


Conflict of interest statement

The authors declare no conflicts of interest.

Figures

FIGURE 1
FIGURE 1
Effects of exercise on DAergic neurons, α‐synuclein, motor function, adult hippocampal neurogenesis, and memory function. (A) Timeline of experimental protocol. (B, C, and D) Immunohistochemistry of TH in substantia nigra (B), striatum (C), and α‐synuclein (D) in striatum tissue sections of mice in different groups. Scale bars, 100 μm. (E, F, and G) The histograms show the number of TH‐positive neurons (E) in the substantia nigra, the TH fiber intensity relative to the control (F) in the striatum, and the relative α‐synuclein intensity (G) in the striatum between groups. (H) The histogram demonstrates the time for mice retaining on the rod for mice in different groups. (I) Image (left) representing DCX (green) immunoreactivity in the hippocampal tissue sections of mice and histogram (right) indicating the DCX‐positive areas (%) between groups. Scale bars, 100 μm. (J) Image (left) representing Nestin (red) immunoreactivity in the hippocampal tissue sections of mice and histogram (right) indicating the Nestin‐positive areas (%) between groups. Scale bars, 100 μm. (K) Image (left) representing Ki67/NeuN (green and purple) colabeling cells in the hippocampal tissue sections of mice and histogram (right) indicating the Ki67/NeuN‐positive areas (%) between groups. (L and M) The histograms indicate the time (s) for mice to locate a displaced platform (L) and the number of mice crossing the platform (M). Immunohistochemistry analysis: n = 4 or 5; behavior analysis: n = 8. Scale bars, 100 μm. *, **, and *** represent the significance levels of p < 0.05, p < 0.01, and p < 0.001, respectively, when comparing the PD (Parkinson disease) with Con (control) groups. †, ††, and ††† indicate the significance levels of p < 0.05, p < 0.01, and p < 0.001, respectively, when comparing the PDEx (PD plus exercise) with MPTP‐treated groups. The symbols ψ, ϕ, &, and # indicate that the training effects are significant in the Con, Ex (healthy mice undergoing exercise), PD, and PDEx groups.
FIGURE 2
FIGURE 2
The Impact of exercise on neuronal apoptosis and microglial activation in the hippocampus of MPTP‐treated mice. (A) Image (left) representing fluorescent double staining of caspase‐3 (red) and Hoechst 33258 (light blue) in the hippocampal tissue sections of mice and histogram (right) indicating the caspase‐3‐positive areas (%) between groups. (B, C, and D) Western blot (B) and densitometric analysis for BAX (C) and Bcl‐2 (D) from the hippocampal tissues of mice in different groups. (E) Image (left) representing fluorescent double staining of Iba‐1 (green) and iNOS (red) in the hippocampal tissue sections of mice and histogram (right) indicating the iNOS‐positive areas (%) between groups. (F) Western blot and densitometric analysis for Iba‐1. (G–J) Western blot (G) and densitometric analysis for TNF‐α (H), p‐NFκB (I), and pro‐IL‐1β (J) from the hippocampal tissues of mice in different groups. Western blot analysis: N = 4–5 and immunohistochemistry analysis: N = 3–4. TNF‐α, Tumor necrosis factor‐alpha. *, **, and *** represent the significance levels of p < 0.05, p < 0.01, and p < 0.001, respectively, when comparing the PD (Parkinson disease) with Con (Control) groups. †, ††, and ††† indicate the significance levels of p < 0.05, p < 0.01, and p < 0.001, respectively, when comparing the PDEx (PD plus exercise) with MPTP‐treated groups.
FIGURE 3
FIGURE 3
The impact of exercise on protein levels of FNDC5/irisin and NLRP3 components in the hippocampus of MPTP‐treated mice. (A–C) The Western blot and densitometric analysis for FNDC5/irisin (A), NLRP3 (B), and ASC (C). (D) Western blot for caspase‐1 and IL‐1β. (E and F) densitometric analysis for caspase‐1 (E) and IL‐1β (F) from the hippocampal tissues of mice in different groups. Western blot analysis: N = 5. *, **, and *** represent the significance levels of p < 0.05, p < 0.01, and p < 0.001, respectively, when comparing the PD (Parkinson disease) with Con (Control) groups. †, ††, and ††† indicate the significance levels of p < 0.05, p < 0.01, and p < 0.001, respectively, when comparing the PDEx (PD plus exercise) with MPTP‐treated groups.
FIGURE 4
FIGURE 4
The impact of MCC950 (MC and irisin treatment on the protein levels of NLRP3 components in the α‐synuclein‐cultured microglial cells. (A) The Western blot and densitometric analysis for the impact of MCC950 on p‐NFκB. (B) The Western blot for the impact of MCC950 on NLRP3 components. (C–F) The densitometric analysis for NLRP3 (C), ASC (D), caspase‐1 (E), and IL‐1β (F) in the α‐synuclein‐cultured microglial cells. (G) The Western blot and densitometric analysis for the impact of α‐synuclein on FNDC5/irisin. (H) The Western blot and densitometric analysis for the impact of irisin and NSS treatment on p‐NFκB. (I) The Western blot for NLRP3 inflammasome components. (J–M) The densitometric analysis for the impact of irisin and NSS on NLRP3 (J), ASC (K), caspase‐1 (L), and IL‐1β (M). Western blot analysis: N = 4. *, **, and *** represent the significance levels of p < 0.05, p < 0.01, and p < 0.001, respectively, when comparing the SYN (α‐synuclein) with Con (control) groups. †, ††, and ††† indicate the significance levels of p < 0.05, p < 0.01, and p < 0.001, respectively, when comparing MCC (α‐synuclein plus MCC950) and irisin (α‐synuclein plus irisin) with SYN groups. §, §§, and §§§ denote the significance levels of p < 0.05, p < 0.01, and p < 0.001, respectively, when comparing the NSS (α‐synuclein plus irisin and nigericin sodium salt) with irisin groups.
FIGURE 5
FIGURE 5
The impact of runner serum, cRGDyk, and NSS on the protein levels of p‐NFκB and NLRP3 components in the α‐synuclein‐cultured microglial cells. (A) The Western blot and densitometric analysis for the impact of runner serum and NSS on NLRP3 in α‐synuclein‐cultured microglia. (B) The Western blot for the impact of runner serum and NSS on p‐NFκB and ASC. (C and D) The densitometric analysis for p‐NFκB (C) and ASC (D). (E) The Western blot for the impact of runner serum and NSS on caspase 1 and IL‐1β. (F and G) The densitometric analysis for caspase‐1 (F) and IL‐1β (G) between groups (n = 4). (H) The Western blot and densitometric analysis for the impact of runner serum on FNDC5/irisin in α‐synuclein‐cultured microglia. (I) The Western blot for the impact of runner serum and cRGDyk on p‐NFκB and NLRP3. (J and K) The densitometric analysis for the impact of runner serum and cRGDyk on p‐NFκB (J) and NLRP3 (K). (L) The Western blot for the impact of runner serum and cRGDyk on ASC, caspase‐1, and Il‐1β. (M–O) The densitometric analysis for the impact of runner serum and cRGDyk on ASC (M), caspase‐1 (N), and IL‐1β (O) between groups. Western blot analysis: N = 4. *, **, and *** represent the significance levels of p < 0.05, p < 0.01, and p < 0.001, respectively, when comparing the SYN (α‐synuclein) with Con (control) groups. †, ††, and ††† indicate the significance levels of p < 0.05, p < 0.01, and p < 0.001, respectively, when comparing the RnSum (α‐synuclein plus Runner serum) with SYN groups. §, §§, and §§§ denote the significance levels of p < 0.05, p < 0.01, and p < 0.001, respectively, when comparing the NSS (α‐synuclein plus RnSum and nigericin sodium salt) and RGD (α‐synuclein plus RnSum and cyclo RGDyk) with RnSum groups.
FIGURE 6
FIGURE 6
Blocking irisin signaling diminished the neuroprotective effects of exercise on microglial activation and NLRP3 inflammasome formation in MPTP‐treated mice. (A and B) The Western blot and densitometric analysis for the impact of cRGDyk administration on exercise‐induced changes in NLRP3 (A) and ASC (B) in MPTP‐treated mice between groups. (C) Western blot for caspase‐1 and IL‐1β. (D and E) densitometric analysis for caspase‐1 (D) and IL‐1β (E) from the hippocampal tissues of mice in different groups. (F) Image (left) representing fluorescent double staining of Iba‐1 (green) and iNOS (red) in the hippocampal tissue sections of mice and histogram (right) indicating the iNOS‐positive areas (%) between groups. (G) Western blot and densitometric analysis for Iba‐1. (H–K) Western blot (H) and densitometric analysis for TNF‐α (I), p‐NFκB (J), and pro‐IL‐1β (K) from the hippocampal tissues of mice in different groups. Western blot analysis: N = 5 and immunohistochemistry analysis: N = 4. §, §§, and §§§ denote the significance levels of p < 0.05, p < 0.01, and p < 0.001, respectively, when comparing the PDExRg (Parkinson disease plus exercise and cyclo RGDyk) with PDEx (PD plus exercise) groups.
FIGURE 7
FIGURE 7
Blocking irisin signaling decreased the effects of exercise on cell apoptosis, AHN, and memory in MPTP‐treated mice. (A) Image (left) representing fluorescent double staining of caspase‐3 (red) and Hoechst 33258 (light blue) in the hippocampal tissue sections of mice and histogram (right) indicating the caspase‐3‐positive areas (%) between groups. (B, C, and D) Western blot (B) and densitometric analysis for BAX (C) and Bcl‐2 (D) from the hippocampal tissues of mice in different groups. (E and F) The histograms indicate the time (s) for mice to locate a displaced platform (E) and the number of crossings of the platform (F). (G) Image (left) representing DCX (green) immunoreactivity in the hippocampal tissue sections of mice and histogram (right) indicating the DCX‐positive areas (%) between groups. Scale bars, 100 μm. (H) Image (left) representing Nestin (red) immunoreactivity in the hippocampal tissue sections of mice and histogram (right) indicating the Nestin‐positive areas (%) between groups. Scale bars, 100 μm. (I) Image (left) representing Ki67/NeuN (green and purple) colabeling cells in the hippocampal tissue sections of mice and histogram (right) indicating the Ki67/NeuN‐positive areas (%) between groups. Western blot analysis: N = 5; immunohistochemistry analysis: N = 4; behavior analysis: N = 8. Scale bars, 100 μm. §, §§, and §§§ denote the significance levels of p < 0.05, p < 0.01, and p < 0.001, respectively, when comparing PDExRg (PD plus exercise and cyclo RGDyk) with PDEx (PD plus exercise) groups. The symbols ψ and ϕ indicate that the training effects are significant in the PDEx and PDExRg groups.
FIGURE 8
FIGURE 8
The effects of recombinant irisin on microglial activation, inflammatory cytokines, and neuronal apoptosis in MPTP‐treated mice. (A–D) Western blot (A) and densitometric analysis for TNF‐α (B), p‐NFκB (C), and pro‐IL‐1β (D) from the hippocampal tissues of mice in different groups. (E) Image (upper) representing fluorescent double staining of Iba‐1 (green) and iNOS (red) in the hippocampal tissue sections of mice and histogram (lower) indicating the iNOS‐positive areas (%) between groups. (F) Image (upper) representing fluorescent double staining of caspase‐3 (red) and Hoechst 33258 (light blue) in the hippocampal tissue sections of mice and histogram (lower) indicating the caspase‐3‐positive areas (%) between groups. (G) Western blot and densitometric analysis for Iba‐1. (H–J) Western blot (H) and densitometric analysis for BAX (I) and Bcl‐2 (J) from the hippocampal tissues of mice in different groups. Western blot analysis: N = 5 and immunohistochemistry analysis: N = 4. §, §§, and §§§ denote the significance levels of p < 0.05, p < 0.01, and p < 0.001, respectively, when comparing the PDIR (PD plus irisin) with MPTP‐treated groups.
FIGURE 9
FIGURE 9
The effects of recombinant irisin treatment on adult hippocampal neurogenesis and memory performance in MPTP‐treated mice. (A) Image (left) representing DCX (green) immunoreactivity in the hippocampal tissue sections of mice and histogram (right) indicating the DCX‐positive areas (%) between groups. Scale bars, 100 μm. (B) Image (left) representing Nestin (red) immunoreactivity in the hippocampal tissue sections of mice and histogram (right) indicating the Nestin‐positive areas (%) between groups. Scale bars, 100 μm. (C) Image (left) representing Ki67/NeuN (green and purple) colabeling cells in the hippocampal tissue sections of mice and histogram (right) indicating the Ki67/NeuN‐positive areas (%) between groups. (D and E) The histograms indicate the time (s) for mice to locate a displaced platform (D) and the number of crossings of the platform (E). Immunohistochemistry analysis: N = 4; behavior analysis: N = 8. Scale bars, 100 μm. §, §§, and §§§ denote the significance levels of p < 0.05, p < 0.01, and p < 0.001, respectively, when comparing the PDIR (PD plus irisin) with MPTP‐treated groups. The symbols ψ and ϕ indicate that the training effects are significant in the PD and PDIR groups.

Similar articles

Cited by

References

    1. Aaron, K. , and Brendon S.. 2021. “Exercise and Inflammation.” In Immuno‐Psychiatry: Facts and Prospects, edited by Berk M., Leboyer M., and Sommer I. E., 431–444. Springer International Publishing.
    1. Aarsland, D. , Creese B., Politis M., et al. 2017. “Cognitive Decline in Parkinson Disease.” Nature Reviews Neurology 13, no. 4: 217–231. 10.1038/nrneurol.2017.27. - DOI - PMC - PubMed
    1. Aarsland, D. , Andersen K., Larsen J. P., Lolk A., Nielsen H., and Kragh‐Sorensen P.. 2001. “Risk of Dementia in Parkinson's Disease: A Community‐Based, Prospective Study.” Neurology 56, no. 6: 730–736. 10.1212/wnl.56.6.730. - DOI - PubMed
    1. Aarsland, D. , Batzu L., Halliday G. M., et al. 2021. “Parkinson Disease‐Associated Cognitive Impairment.” Nature Reviews. Disease Primers 7, no. 1: 47. 10.1038/s41572-021-00280-3. - DOI - PubMed
    1. Ahmadi, A. , Kashef M., Rajabi H., and Salehpour M.. 2022. “Effects of Exercise Preconditioning on NLRP3 and Mitochondrial Fission in Isoproterenol‐Induced Myocardial Infarcted Rats.” Comparative Clinical Pathology 32: 289–297. 10.1007/s00580-022-03397-3. - DOI

LinkOut - more resources