. 2025 May;12(20):e2412558.
doi: 10.1002/advs.202412558. Epub 2025 Apr 7.

Gut Microbiota Modulation by Inulin Improves Metabolism and Ovarian Function in Polycystic Ovary Syndrome

Affiliations

Gut Microbiota Modulation by Inulin Improves Metabolism and Ovarian Function in Polycystic Ovary Syndrome

Lulu Geng et al. Adv Sci (Weinh). 2025 May.

Abstract

The management of metabolic disorder associated with polycystic ovary syndrome (PCOS) has been suggested as an effective approach to improve PCOS which is highly involved with gut microbiota, while the underlying mechanism is unclear. Here, we investigated the role of inulin, a gut microbiota regulator, in the alleviation of PCOS. Our findings showed that inulin treatment significantly improved hyperandrogenism and glucolipid metabolism in both PCOS cohort and mice. Consistent with the cohort, inulin increased the abundance of microbial co-abundance group (CAG) 12 in PCOS mice, including Bifidobacterium species and other short-chain fatty acids (SCFAs)-producers. We further verified the enhancement of SCFAs biosynthesis capacity and fecal SCFAs content by inulin. Moreover, inulin decreased lipopolysaccharide-binding protein (LBP) and ameliorated ovarian inflammation in PCOS mice, whereas intraperitoneal lipopolysaccharide (LPS) administration reversed the protective effects of inulin. Furthermore, fecal microbiota transplantation (FMT) from inulin-treated patients with PCOS enhanced insulin sensitivity, improved lipid accumulation and thermogenesis, reduced hyperandrogenism and ovarian inflammatory response in antibiotic-treated mice. Collectively, these findings revealed that gut microbiota mediates the beneficial effects of inulin on metabolic disorder and ovarian dysfunction in PCOS. Therefore, modulating gut microbiota represents a promising therapeutic strategy for PCOS.

Keywords: fecal microbiota transplantation; gut microbiota; inulin; polycystic ovary syndrome; short‐chain fatty acids.


Conflict of interest statement

The authors declare no competing interests.

Figures

Figure 1
Figure 1
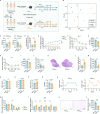
Inulin alleviates metabolic disorders and ovarian dysfunction in PCOS mice. A) Schematic diagram of the PCOS‐like mouse model with or without inulin treatment. NC, normal control mice with a chow diet and normal drinking water; PCOSCtr, mice injected with DHEA and fed with a high‐fat diet (HFD) and normal drinking water; PCOSInu, mice injected with DHEA, fed with HFD, and treated with inulin in drinking water; EC, estrous cycles; GTT, intraperitoneal glucose tolerance test; ITT, intraperitoneal insulin tolerance test. B) Percentage growth in body weight during the experimentation. C and D) Blood glucose levels of NC, PCOSCtr, and PCOSInu mice in GTT (C) and area under the curve (AUC) of GTT (D). E and F) Blood glucose levels of NC, PCOSCtr, and PCOSInu mice in ITT (E) and AUC of ITT (F). G) Fasting insulin levels of NC, PCOSCtr, and PCOSInu mice. H) Representative H&E‐stained histological sections of ovaries (5×, scale bar = 100 µm) from NC, PCOSCtr, and PCOSInu mice. *indicates cystic follicle; # indicates corpora luteum. I) Number of cystic follicles and corpora luteum. J) Serum testosterone levels of NC, PCOSCtr, and PCOSInu mice. K) Serum antimullerian hormone (AMH) levels of NC, PCOSCtr, and PCOSInu mice. L‐N) Serum luteinizing hormone (LH) (L) and follicle‐stimulating hormone (FSH) (M) levels and LH‐to‐FSH ratios (LH/FSH) (N) of NC, PCOSCtr, and PCOSInu mice. O) Representative estrous cycles of NC, PCOSCtr, and PCOSInu mice. P, proestrus; E, estrus; M, metestrus; D, diestrus. P) Quantitative analysis of each phase in estrous cycles. Q) RT‐qPCR analysis of mRNA expression levels of Ucp1, Pgc1a, Pparα, Dio2, and Cited1 in the brown adipose tissue (BAT) from NC, PCOSCtr, and PCOSInu mice. R) Representative H&E‐stained histological sections of peri‐ovarian adipose tissue (20×, scale bar = 100 µm) from NC, PCOSCtr, and PCOSInu mice. S) Peri‐ovarian adipocyte mean area distribution. The data are shown as the mean ± standard error of the mean (SEM) and statistical significance was analyzed by one‐way ANOVA with Tukey's multiple comparisons test (n = 6 mice per group). For (C) and (E), * indicates NC versus PCOSCtr; # indicates PCOSCtr versus PCOSInu. *p < 0.05, **p < 0.01, ***p < 0.001, and ****p < 0.0001; #p < 0.05 and ##p < 0.01.
Figure 2
Figure 2
Inulin increases SCFAs‐producing bacteria in the gut of PCOS mice. A and B) Distribution of relative abundance of microbial taxa at phylum (A) and genus (B) levels in NC, PCOSCtr, and PCOSInu mice. Phyla or genera with less than 1% relative abundance in the sample are classified as others. C) Ratios of Firmicutes to Bacterioidetes (F/B) in NC, PCOSCtr, and PCOSInu mice. D‐F) The gut microbial community diversity (D) and richness (E and F) of NC, PCOSCtr, and PCOSInu mice. G and H) Overall structure of gut microbiota in NC, PCOSCtr, and PCOSInu mice. Principal coordinate analysis (PCoA) based on the weighted UniFrac distance of amplicon sequence variants (ASVs) and between‐group differences determined by Adonis analysis (G). The overall gut microbial structure of PCOSInu mice is more similar to NC mice (H). I and J) PCoA based on the Bray‐Curtis distance of carbohydrate‐active enzyme (CAZy) family genes in NC, PCOSCtr, and PCOSInu mice (I). The CAZy family genes of PCOSInu mice are more similar to NC mice (J). K) The abundance of CAZy family genes in NC, PCOSCtr, and PCOSInu mice. L) The abundance of CAZy genes (GH32 and GH91) involved in inulin metabolism in NC, PCOSCtr, and PCOSInu mice. M‐O) Alterations in the abundance of genes encoding key enzymes in the production pathways for (M) acetic acid (AA), (N) propionic acid (PA), and (O) butyric acid (BA) in NC, PCOSCtr, and PCOSInu mice. AA production: formate‐tetrahydrofolate ligase; PA production: propionyl‐CoA:succinate‐CoA transferase and propionate CoA‐transferase; BA production: represented by the total abundances of genes encoding the following enzymes: 4Hbt, butyryl–coenzyme A (butyryl‐CoA): 4‐hydroxybutyrate CoA transferase; Ato, butyryl‐CoA: acetoacetate CoA transferase; Buk, butyrate kinase; But, butyryl‐CoA: acetate CoA transferase. P and Q) The concentration of total (P) and three major short‐chain fatty acids (SCFAs) including AA, PA, and BA (Q) in the caecum of NC, PCOSCtr, and PCOSInu mice. R) Heatmap of the Spearman's correlation between the top 40 most abundant bacteria genera and SCFAs in mice. Red squares represent positive correlations, while blue squares represent negative correlations. P‐values less than 0.05 are marked with asterisks. *p < 0.05, **p < 0.01, and ***p < 0.001. For (C)‐(F) and (K)‐(O), data are shown as violin plots with the median, interquartile ranges (IQRs), and min/max values; for (H) and (J), data are presented as the mean ± SEM. Statistical significance was analyzed by one‐way ANOVA with Tukey's multiple comparisons test (n = 5 mice per group). *p < 0.05, **p < 0.01, ***p < 0.001 and ****p < 0.0001. [Correction added on 21 April 2025, after first online publication: Figure 2 is updated in this version.]
Figure 3
Figure 3
Inulin modifies microbial co‐abundant groups (CAGs) in PCOS mice. A) The interaction between different CAGs by microbial co‐abundance network. The node size reflects the mean abundance of species, with larger nodes corresponding to higher abundance. The lines connecting the nodes reflect correlations (pink represents negative correlation, blue represents positive correlation), with the line width indicating the strength of the correlation. B) Changes in the abundance of CAGs in NC, PCOSCtr, and PCOSInu mice. The sizes and colors of circles indicate the relative abundance and the adjusted P value of CAGs, respectively. The CAG number highlighted in orange indicates significant differences analyzed by the Kruskal‐Wallis test (n = 5 per group).
Figure 4
Figure 4
Inulin ameliorates impaired intestinal barrier and ovarian inflammation in PCOS mice. A‐C) RT‐qPCR analysis of mRNA expression levels of Zo1, Occludin, and Claudin1 in the colon from NC, PCOSCtr, and PCOSInu mice. D‐G) Immunohistochemical staining and analysis of Zo1, Occludin, and Claudin1 in the colon from NC, PCOSCtr, and PCOSInu mice (10×, scale bar = 100 µm). H‐J) Serum levels of LBP (H), IL‐1β (I), and IL‐18 (J) in NC, PCOSCtr, and PCOSInu mice. K‐N) Western blotting bands presenting protein expression levels of TLR4, Myd88, p‐NF‐κB (K) and NLRP3, ASC, cleaved‐Caspase1, cleaved‐GSDMD (M) in the ovary from NC, PCOSCtr, and PCOSInu mice. Relative protein expression levels were determined via quantification of band intensities normalized by β‐actin (L and N). The data are shown as the mean ± SEM and statistical significance was analyzed by one‐way ANOVA with Tukey's multiple comparisons test. For (A)‐(G) and (L)‐(N), n = 6 mice per group; for (H)‐(K), n = 3 mice per group. *p < 0.05, **p < 0.01, ***p < 0.001, and ****p < 0.0001.
Figure 5
Figure 5
Alteration of gut microbiota in patients with PCOS after inulin intervention. A) Flow chart of the study design. B) Ratios of Firmicutes to Bacterioidetes (F/B) among patients with PCOS pre‐inulin (Pre), 1 month post‐inulin (Post1 M), and 3 months post‐inulin (Post3 M) intervention. C) The microbial dysbiosis index of Pre, Post1 M, and Post3 M groups. D and E) The alpha‐diversity of gut microbiota in Pre, Post1 M, and Post3 M groups. F and G) Distribution of relative abundance of microbial taxa at phylum (F) and genus (G) levels in Pre, Post1 M, and Post3 M groups. Phyla or genera with less than 1% relative abundance in the sample are classified as others. H) Classification performance of the 7 most discriminant genera by a random forest model. I) Comparison of relative abundance of Bifidobacterium in the gut of patients with PCOS between Pre and Post groups. J) Heatmap of the Spearman's correlation between key bacteria genera and clinical parameters in patients with PCOS. Red squares represent positive correlations, while blue squares represent negative correlations. P‐values less than 0.05 are marked with asterisks. *p < 0.05, **p < 0.01, and ***< 0.001. For (B)‐(E) and (I), data are shown as violin plots with the median, interquartile ranges (IQR), and min/max values; two‐tailed Wilcoxon matched‐pairs test was used to analyze differences between the Pre and Post1 M groups or the Pre and Post3 M groups. The sample size: = 45 patients per group. *< 0.05, **p < 0.01, ***< 0.001, and ****< 0.0001.
Figure 6
Figure 6
Improved metabolic outcomes in mice after the fecal microbiota transplantation of patients with PCOS post‐inulin intervention. A) Schematic diagram of the fecal microbiota transplantation (FMT) experiments. Fecal samples were collected from randomly selected three donors of patients with PCOS pre‐ and post‐inulin intervention, respectively. The mice were treated with an antibiotic cocktail prior to the FMT. FMTPre, recipient mice inoculated with the pooled fecal microbiota from pre‐inulin PCOS patients (DonorPre); FMTPost, recipient mice inoculated with the pooled fecal microbiota from post‐inulin PCOS patients (DonorPost). All the recipient mice were fed with HFD after FMT; EC, estrous cycles; GTT, intraperitoneal glucose tolerance test; ITT, intraperitoneal insulin tolerance test. B) PCoA based on the Bray‐Curtis distance of species in recipient mice and PCOS donors. C) The overall gut microbial structure of recipient mice is more similar to their fecal donors. D) Comparison of Bifidobacterium animalis based on the shallow metagenome sequencing data between FMTPre and FMTPost mice. E) Percentage growth in body weight during the FMT experiment. F and G) Blood glucose levels of FMTPre and FMTPost mice in GTT (F) and AUC of GTT (G). H and I) Blood glucose levels of FMTPre and FMTPost mice in ITT (H) and AUC of ITT (I). J) Fasting insulin levels of FMTPre and FMTPost mice. K and L) Representative H&E‐stained histological sections of ovaries (5×, scale bar = 100 µm); # indicates corpora luteum (K). Number of corpora lutea in FMTPre and FMTPost mice (L). M) Serum testosterone levels of FMTPre and FMTPost mice. N) Serum AMH levels of FMTPre and FMTPost mice. O‐Q) Serum LH (O) and FSH (P) levels and LH‐to‐FSH ratios (Q) of FMTPre and FMTPost mice. R and S) Representative estrous cycles of FMTPre and FMTPost mice (R) and quantitative analysis of each phase in estrous cycles (S). P, proestrus; E, estrus; M, metestrus; D, diestrus. T) RT‐qPCR analysis of mRNA expression levels of Ucp1, Pgc1a, Pparα, Dio2, and Cited1 in BAT from FMTPre and FMTPost mice. U and V) Representative H&E‐stained histological sections of peri‐ovarian adipose tissue (20×, scale bar = 100 µm) from FMTPre and FMTPost mice (U) and quantitative analysis of adipocyte mean area (V). The data are shown as the mean ± SEM and statistical significance was analyzed by two‐tailed Student's t‐test. For (B)‐(D), n = 5 mice per group; for (E)‐(V), n = 6 mice per group. *p < 0.05, **p < 0.01, ***p < 0.001, and ****< 0.0001.
Figure 7
Figure 7
Post‐inulin microbiota increases SCFAs and enhances the intestinal barrier in mice. A and B) The concentration of total (A) and three major SCFAs (B) including AA, PA, and BA in the caecum of FMTPre and FMTPost mice. C‐E) RT‐qPCR analysis of mRNA expression levels of Zo1, Occludin, and Claudin1 in the colon from FMTPre and FMTPost mice. F‐I) Immunohistochemical staining and analysis of Zo1, Occludin, and Claudin1 in the colon from FMTPre and FMTPost mice (10×, scale bar = 100 µm). J‐L) Serum levels of LBP (J), IL‐1β (K), and IL‐18 (L) in FMTPre and FMTPost mice. M‐P) Western blotting bands presenting protein expression levels of TLR4, Myd88, p‐NF‐κB (M) and NLRP3, ASC, cleaved‐Caspase1, cleaved‐GSDMD (N) in the ovary from FMTPre and FMTPost mice. Relative protein expression levels were determined via quantification of band intensities normalized by β‐actin (O and P). The data are shown as the mean ± SEM and statistical significance was analyzed by two‐tailed Student's t‐test. For (A) and (B), n = 5 mice per group; for (C)‐(L), n = 6 mice per group; for (M)‐(P), n = 3 mice per group. *p < 0.05, **p < 0.01, and ***p < 0.001.

References

    1. Joham A. E., Norman R. J., Stener‐Victorin E., Legro R. S., Franks S., Moran L. J., Boyle J., Teede H. J., Lancet Diabetes Endocrinol. 2022, 10, 668. - PubMed
    1. Escobar‐Morreale H. F., Nat. Rev. Endocrinol. 2018, 14, 270. - PubMed
    1. Walter K., JAMA, J. Am. Med. Assoc. 2022, 327, 294. - PubMed
    1. Stener‐Victorin E., Teede H., Norman R. J., Legro R., Goodarzi M. O., Dokras A., Laven J., Hoeger K., Piltonen T. T., Nat. Rev. Dis. Primers 2024, 10. - PubMed
    1. Anagnostis P., Tarlatzis B. C., Kauffman R. P., Metabolism 2018, 86, 33. - PubMed

MeSH terms

LinkOut - more resources