. 2025 Jun;12(23):e2416478.
doi: 10.1002/advs.202416478. Epub 2025 Apr 7.

Cardiomyocyte-Enriched USP20 Ameliorates Pathological Cardiac Hypertrophy by Targeting STAT3 Deubiquitination

Affiliations

Cardiomyocyte-Enriched USP20 Ameliorates Pathological Cardiac Hypertrophy by Targeting STAT3 Deubiquitination

Lingfeng Zhong et al. Adv Sci (Weinh). 2025 Jun.

Abstract

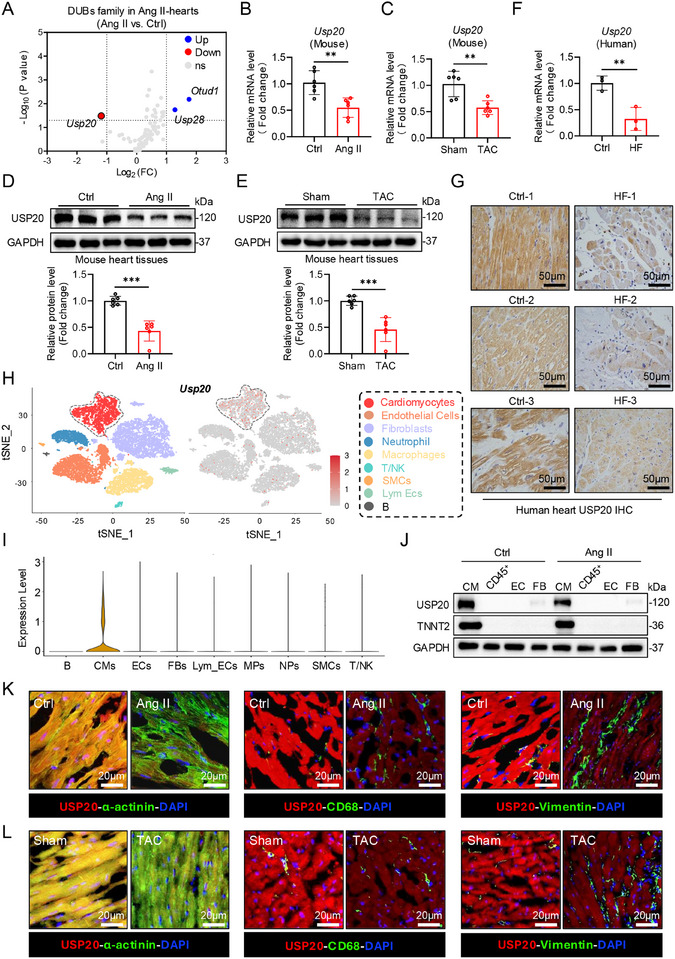
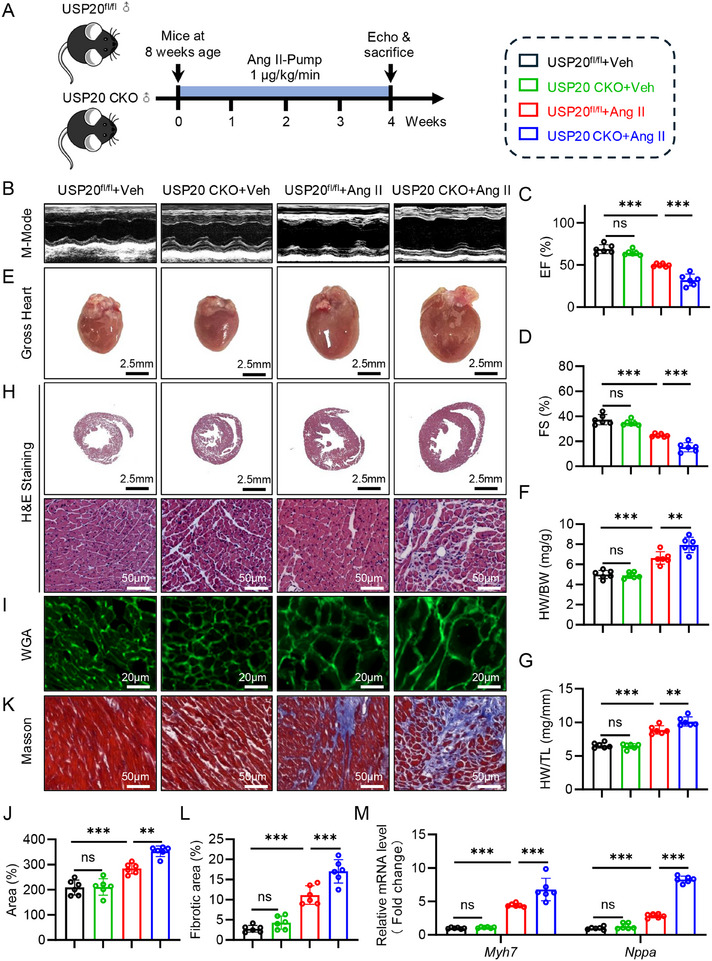
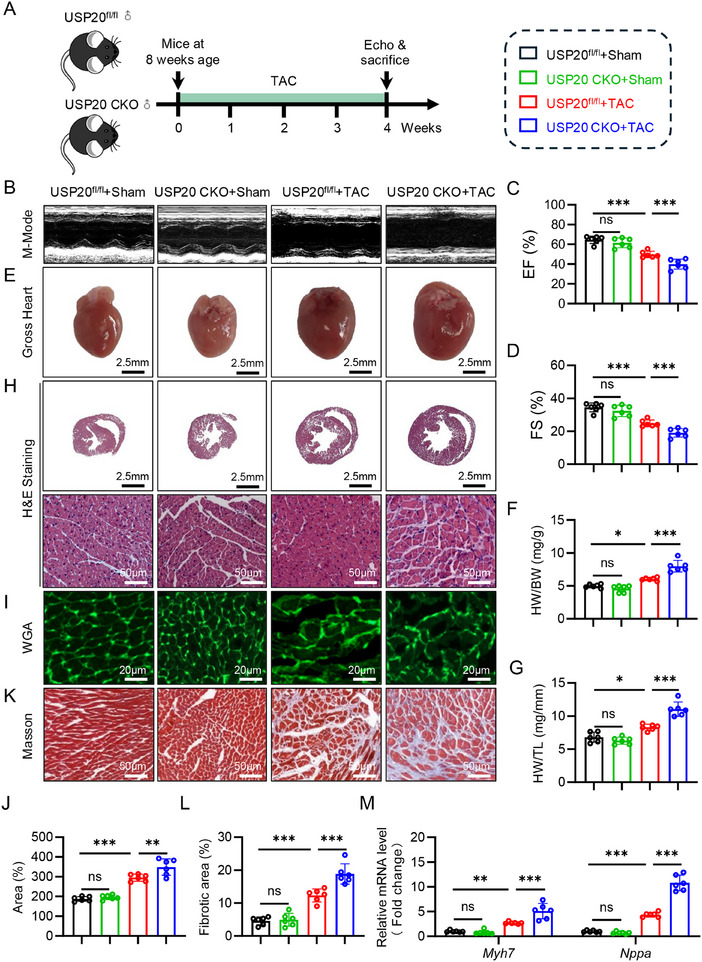
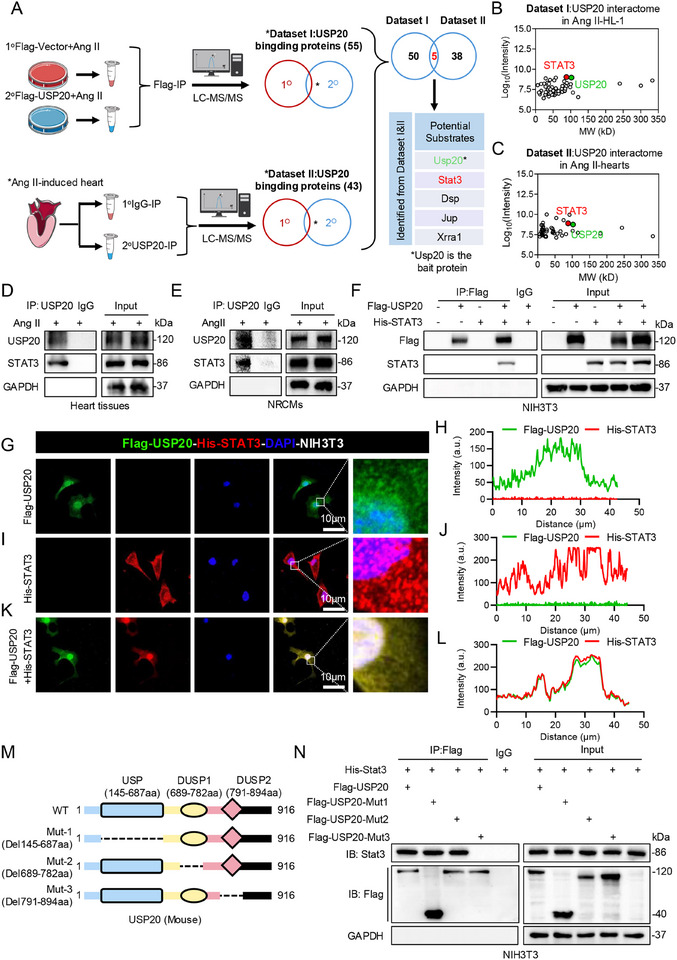
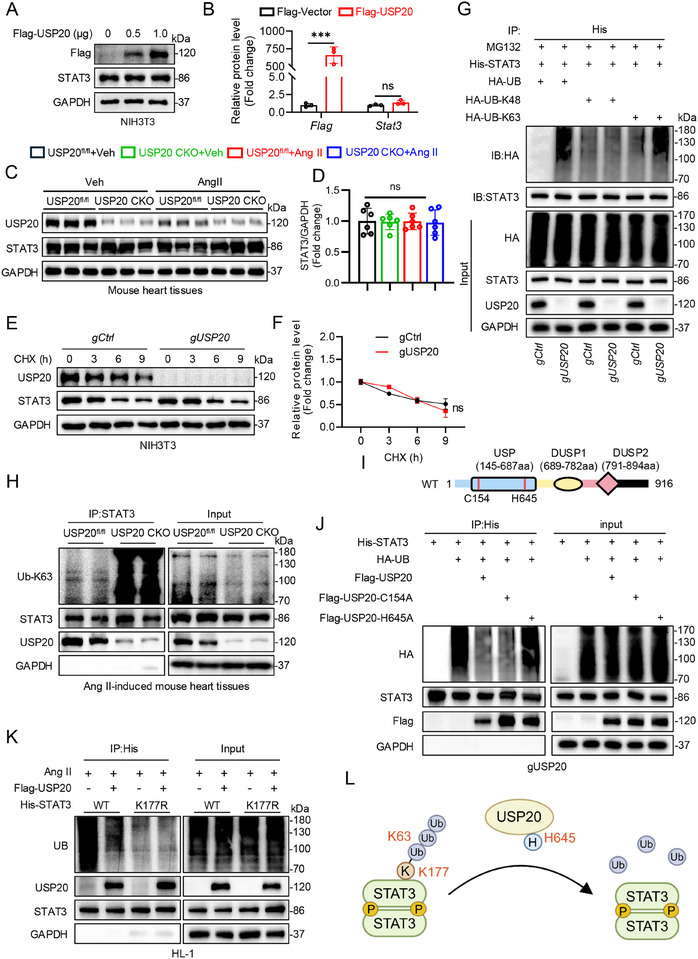
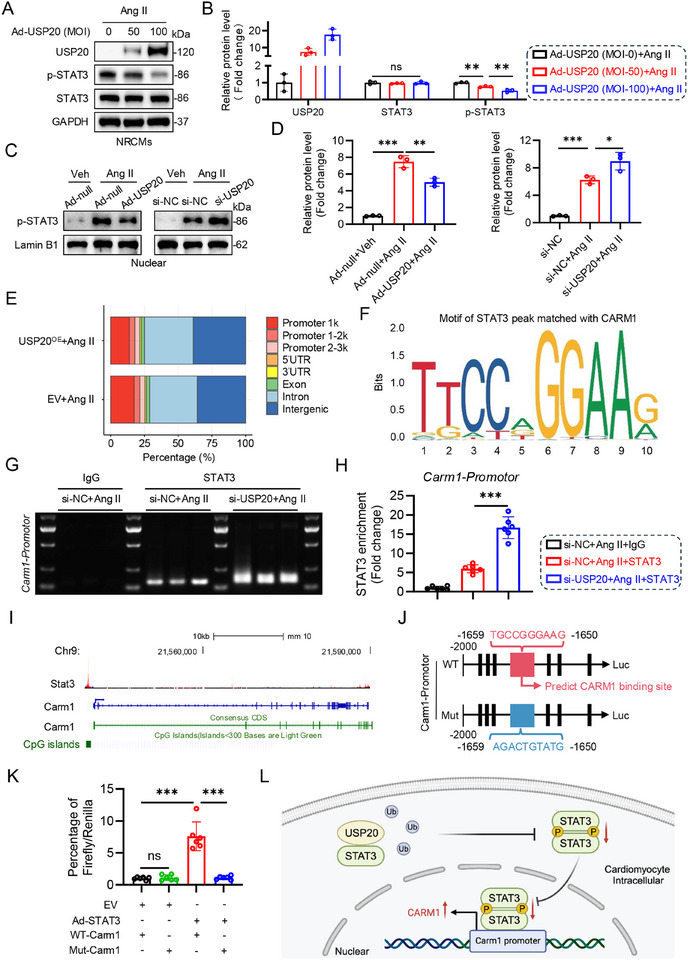
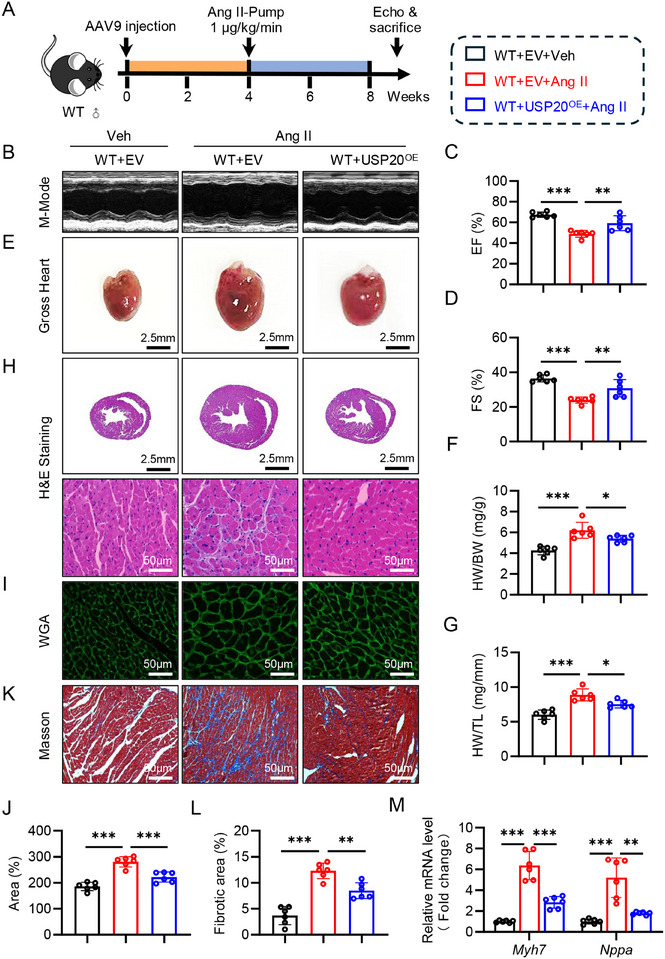
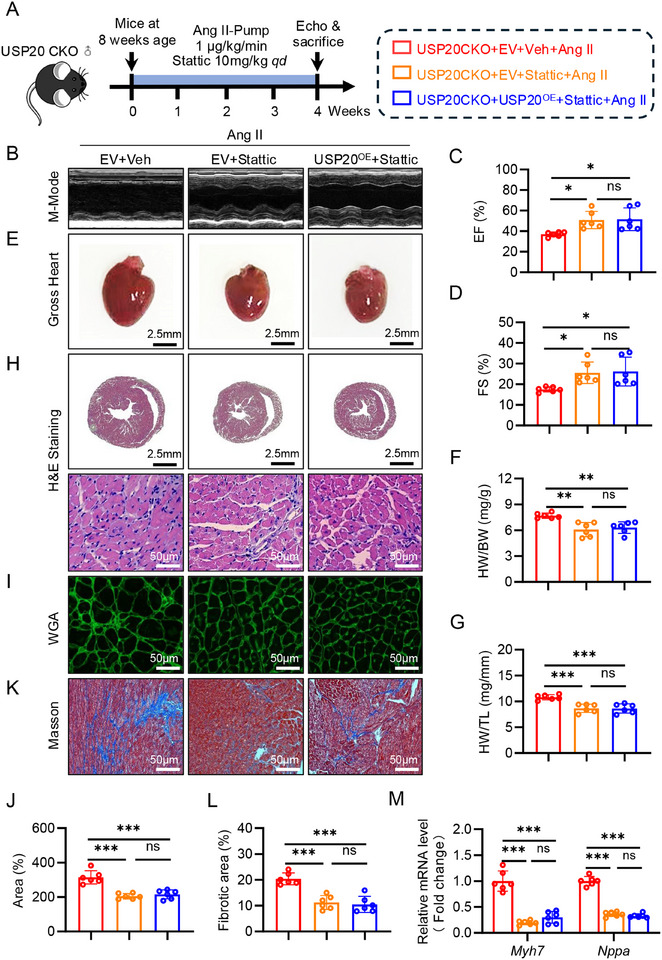
Although pathological cardiac hypertrophy is a key driver of heart failure, the underlying mechanisms remain incompletely elucidated. This study investigates the role and mechanism of deubiquitinating enzyme (DUB) ubiquitin-specific protease 20 (USP20) in cardiac hypertrophy. Transcriptomic profiling of hypertrophic hearts shows significant alterations in the expression of DUBs, including a remarkable downregulation of USP20. USP20 is predominantly expressed in cardiomyocytes. Co-immunoprecipitation (Co-IP) followed by liquid chromatography-tandem mass spectrometry (LC-MS/MS) is used to identify USP20 substrates. Cleavage Under Targets and Tagmentation assay (CUT&Tag) sequencing is employed to identify downstream targets of signal transducer and activator of transcription 3 (STAT3). Functionally, USP20 deficiency exacerbates cardiac hypertrophy induced by either angiotensin II (Ang II) or transverse aortic constriction (TAC), whereas USP20 overexpression alleviates hypertrophic responses. Mechanistically, USP20 deubiquitinates STAT3 by removing K63-linked ubiquitin chains at K177 via its H645 active site, reducing STAT3 phosphorylation and nuclear translocation. This inhibites STAT3's transcriptional activity at coactivator-associated arginine methyltransfer (Carm1) promoter, leading to upregulated CARM1 expression and mitigated hypertrophy. Importantly, the STAT3 inhibitor Stattic confirms STAT3 serves as a key substrate mediating the cardiac protective effects of USP20. These findings unveil a novel USP20/STAT3/CARM1 axis in cardiomyocytes and reveal its therapeutic potential for cardiac hypertrophy.

Keywords: cardiac hypertrophy; cardiomyocyte; deubiquitinating enzyme; signal transducer and activator of transcription 3; ubiquitin‐specific protease 20.


Conflict of interest statement

The authors declare no conflict of interest.

Figures

Figure 1
Figure 1
Identification of cardiomyocyte‐enriched USP20 as a downregulated factor in mouse and human cardiac hypertrophy. A) Wild type (WT) male mice were induced hypertrophic myocardium by Ang II (please refer to the Supplementary data online for detailed methods). The heart samples from vehicle and Ang II‐administered mice were harvested for RNA transcriptome sequencing and showed the expression profiles of deubiquitinating enzymes (DUBs). We used log2 fold change as the data source of x‐axis and log10 P‐value as the data source of y‐axis. Blue dots and red dots represent upregulated and downregulated DUBs compared to the control group, respectively. Gray dots indicate DUBs with no statistically significant difference compared to the control group. B,C) RT‐qPCR analysis of Usp20 mRNA level in Ang II‐ (B) and TAC‐(C) induced hypertrophic myocardium. n = 6. **p < 0.01. D,E) The protein level of USP20 in the heart tissues was determined by immunoblotting in Ang II‐ (D) and TAC‐ (E) induced cardiac hypertrophy. n = 6. ***p < 0.001. F) RT‐qPCR analysis of Usp20 mRNA level in human hearts from control or patients diagnosed with cardiac hypertrophy. n = 3. HF = heart failure. **p < 0.01. G) Representative images of immunohistochemical staining of USP20 as from (F). H,I) Single‐cell mRNA sequencing was conducted on the hearts from Ang II‐administered mice. H) tSNE plot showing 9 main cell types, including Cardiomyocytes (CMs), Endothelial Cells (ECs), fibroblasts (FBs), Neutrophil (NPs), Macrophages (MPs), T/NK cells (T/NK), smooth muscle cells (SMCs) and B cells (B) (Left). Biaxial scatter plot illustrating Usp20 expression patterns across these cell types (Right). I) Violin plot shows that Usp20 expression patterns in these cell types. J) Cardiomyocytes (CMs), fibroblasts (FBs, CD45CD140α+), immune cells (CD45+), and endothelial cells (CD45CD31+) in the heart tissues from vehicle or Ang II‐administrated mice were sorted by flow cytometry and determined USP20 expression. K,L) The cellular origin of USP20 in heart sections in mice induced by Ang II (K) and TAC (L) were assessed using immunofluorescence staining Red: USP20; Green: α‐actinin for cardiomyocyte; CD68 for macrophage; vimentin for fibroblast.
Figure 2
Figure 2
Cardiomyocyte‐specific deficiency of USP20 exacerbates cardiac hypertrophy and dysfunction induced by Ang II. A) Schematic illustration of the experimental design of USP20 in Ang II‐induced cardiac dysfunction and myocardial hypertrophy: USP20fl/fl as control and cardiomyocyte‐specific USP20 deficiency (USP20 CKO) mice were implanted with Ang II‐infused osmotic mini‐pump (1000 ng kg/min) or saline for 4 weeks. B–D) Representative echocardiographic images from each group in mice. n = 6 (B). Quantification of ejection fraction (EF) (C) and fractional shortening (FS) (D) of each group, n = 6. E) Representative images of gross‐heart of each group. n = 6 per group. Scale bar, 2.5 mm. F) The ratio of heart weight (HW) to body weight (BW). G) The ratio of heart weight (HW) to tibial length (TL). H) Representative HE stained images of heart sections. n = 6. Scale bar, 2.5 mm and 50 µm. I,J) Representative wheat germ agglutinin (WGA) stained images of heart sections, n = 6. Scale bar, 20 µm (I), and quantification of WGA of each group (J). K,L) Representative masson stained images of myocardial interstitium in heart sections. Scale bar, 50 µm (K) and quantitative analysis (L). M) RT‐qPCR analysis of Myh7 and Nppa in the heart tissues, n = 6. ns., no significance, **p < 0.01, ***p < 0.001.
Figure 3
Figure 3
Deficiency of cardiomyocyte‐specific USP20 aggravates cardiac hypertrophy and dysfunction induced by TAC. A) A schematic diagram illustrating the experimental for USP20‐mediated cardiac dysfunction and myocardial hypertrophy induced by TAC: TAC or sham surgery was performed in USP20fl/fl as control and cardiomyocyte‐specific USP20 deficiency (USP20 CKO) mice for 4 weeks. B–D) Representative echocardiographic images from each group in mice (B). n = 6. Quantification of ejection fraction (EF) (C) and fractional shortening (FS) (D) of each group n = 6. E) Representative images of gross‐heart of each group. n = 6. Scale bar, 2.5 mm. F) The ratio of heart weight (HW) to body weight (BW). G) The ratio of heart weight (HW) to tibial length (TL). H) Representative HE stained images of heart sections, n = 6. Scale bar, 2.5 mm and 50 µm. I,J) Representative wheat germ agglutinin (WGA) stained images of heart sections, n = 6. Scale bar, 20 µm (I), and quantification of WGA of each group (J). K,L) Representative masson stained images of myocardial interstitium in heart sections. Scale bar, 50 µm. (K) and quantitative analysis (L). M) RT‐qPCR analysis of Myh7 and Nppa in heart tissues. n = 6. ns., no significance, *p < 0.05, **p < 0.01, and ***p < 0.001.
Figure 4
Figure 4
Identification of STAT3 as a substrate of USP20 in cardiomyocytes. A) Schematic illustration of the experimental design for the two interactomes used for USP20 substrate screening. HL‐1 cells (Dataset I) were transfected with either Flag‐vector or Flag‐USP20 following Ang II stimulation at 1 µmol for 24 h. The heart tissues (Dataset II) from mice induced by Ang II were lysed and divided into two portions. The binding proteins were extracted and digested into peptides, and analyzed by liquid chromatography‐mass spectrometry/mass spectrometry (LC‐MS/MS). The list is the potential USP20 substrates identified from the interactomes. B,C) 2D plots with the log10 signal intensity of the quantified proteins on the y axis and the molecular weight (MW) of proteins on the x axis were identified from Dataset I (B) and II (C). D) Immunoprecipitation (IP) of USP20 and STAT3 in the heart tissues from Ang II‐ or vehicle‐treated mice. E) IP of USP20 and STAT3 in Ang II‐incubated neonatal rat cardiomyocytes (NRCMs). F) Co‐IP assays were conducted using NIH3T3 cells transfected with Flag‐USP20 or His‐STAT3, as well as cells co‐transfected with Flag‐USP20 and His‐STAT3 plasmids. G,H) Immunofluorescence of exogenous Flag‐USP20 (green) in NIH3T3 transfected Flag‐USP20 plasmid (G) and quantitative analysis (H). The immunofluorescence of His (red) was performed to exclude non‐specific signals from His antibody and the TRITC‐labeled secondary antibody. I,J) Immunofluorescence of exogenous His‐STAT3 (red) in NIH3T3 transfected His‐STAT3 plasmid (I) and quantitative analysis (J). The immunofluorescence of Flag (green) was performed to exclude non‐specific signals from Flag antibody and the Alexa Fluor 488‐labeled secondary antibody. K,L) Co‐localization of exogenous Flag‐USP20 (green) and His‐STAT3 (red) in NIH3T3 expressing Flag‐USP20 and His‐STAT3 (K) and quantitative analysis (L). M) Schematic illustration of the USP20 domain deletion construct used in (N). N) Co‐IP of wt‐USP20, mut‐USP20, and STAT3 in NIH3T3 cells co‐transfected with overexpression plasmids of Flag‐wt‐USP20, Flag‐mut‐USP20 and His‐STAT3. Exogenous normal or mutated USP20 was immunoprecipitated with anti‐Flag antibody.
Figure 5
Figure 5
USP20 attenuates the K63‐linked deubiquitination of STAT3 at residue K177 through the active site H645. A,B) Overexpression of USP20 Flag‐plasmid was transfected into NIH3T3 cells for 24 h. The levels of Flag and STAT3 were assesses by immunoblotting (A) and the corresponding quantitative analysis (B) n = 3. n.s., no significance, ***p < 0.001. C,D) USP20 CKO and USP20fl/fl mice were induced myocardial hypertrophy by Ang II. USP20 and STAT3 expression (C) in the hearts was determined as in (A) and the quantitative analysis of STAT3 (D). n = 6. ***p < 0.001, ns., no significance. E,F) NIH3T3 cells were infected with lentivirus containing empty vector (gCtrl) or USP20‐gRNA (gUSP20) at multiplicith of infection (MOI) of 50. After antibiotic selection, USP20−/−‐NIH3T3 cells were obtained. Either gCtrl or gUSP20 were incubated with cycloheximide (CHX). The USP20 and STAT3 expression (E) was examined as in (A) and densitometric quantification of STAT3 (F). n = 3. ns., no significance. G) NIH3T3 cells were co‐transfected either gCtrl or gUSP20 with overexpression plasmids of His‐STAT3, HA‐Ub, HA‐K48, and HA‐K63, and then incubated with MG132 at 10 µmol for IP of STAT3. Ubiquitinated STAT3 was detected by immunoblotting with an His‐specific antibody to clarify the ubiquitination pattern of STAT3 regulated by USP20. H) IP of STAT3 in the heart tissues of USP20fl/fl or USP20 CKO mice treated with Ang II for induction of myocardial hypertrophy. Ubiquitinated STAT3 was determined by immunoblotting using an Ub‐K63 antibody to clarify the K63 ubiquitination level of STAT3 regulated by USP20. I) Schematic illustration of the USP20 active site deletion construct used in J. J) IP of STAT3 in gUSP20 that co‐transfected with overexpression plasmids of His‐STAT3, HA‐Ub, Flag‐USP20, Flag‐USP20C154A and Flag‐USP20H645A. Exogenous ubiquitinated STAT3 was detected by immunoblotting using an His‐specific antibody to identify the active site of USP20 regulating ubiquitination of STAT3. K) IP of STAT3 in Ang II‐incubated HL‐1 cells that co‐transfected with overexpression plasmids of His‐STAT3WT, His‐STAT3K177R, Flag‐USP20. Exogenous ubiquitinated STAT3 was detected by immunoblotting using an His‐specific antibody to identify the ubiquitination site of STAT3 regulated by USP20. L) Schematic illustration showing that USP20 attenuates the K63‐linked deubiquitination of STAT3 at residue K177 through the active site H645.
Figure 6
Figure 6
USP20 protects heart from cardiac hypertrophy by inhibiting STAT3 nuclear transcription to promote CARM1 expression. A,B) NRCMs were infected with adenovirus (Ad) encoding USP20 (Ad‐USP20) of multiplicity of infection at MOI of 50 or 100 and Ad‐null as control, then incubated with Ang II at 1 µmol for 24 h. The expression of USP20, p‐STAT3 and STAT3 was examined (A) and quantitative analysis (B). n = 3. **p < 0.01, ns., no significance. C,D) NRCMs were transfected with Ad‐Null or Ad‐USP20, and si‐NC (NC, negative control) or si‐USP20 following stimulation with Ang II at 1 µmol for 24 h. Western blotting for p‐STAT3 and Lamin B1 in nuclear (C) and the quantitative analysis (D). n = 3. *p < 0.05, **p < 0.01, and ***p < 0.001. E) HL‐1 cells were transfected with plasmids of EV (empty vector) or USP20OE and stimulated with Ang II for cleavage under targets and tagmentation (CUT&Tag) assay. F) The motif of STAT3 peak matched with CARM1. G) CUT&Tag was performed on si‐NC or si‐USP20‐transfected HL‐1 cells to verify STAT3 binding to the promoter regions of the Carm1 gene. H) CUT&Tag‐qPCR assay for the binding of STAT3 at Carm1 promoter regions. n = 6. ***p < 0.001. I) The analysis of Chip‐seq data of STAT3 in mouse available in the ENCODE database predicted that STAT3 binds to the promoter region of Carm1. J) Schematic diagram of the construction of wild type (WT) and mutant (Mut) luciferase reporter plasmids of Carm1 promoter. K) NIH3T3 cells were transfected with WT‐Carm1 or Mut‐Carm1 luciferase reporter plasmid and either WT‐STAT3 vector or control vector. The transfected cells were analyzed for luciferase activity. n = 6. ***p < 0.001. L) The schematic illustrates that USP20 inhibits nuclear translocation and promoter regions (e.g., Carm1) binding of STAT3, thereby regulating gene expression through STAT3 in cardiomyocytes.
Figure 7
Figure 7
Cardiomyocyte‐specific overexpression of USP20 improves cardiac hypertrophy and dysfunction induced by Ang II. A) WT mice were injected with adeno‐associated virus serotype 9 (AAV9) mediated cardiomyocyte‐specific overexpression of USP20 (USP20OE) or empty vector (EV) (2 × 1011 v.g., i.v.). Four weeks later, the mice were induced to cardiac hypertrophy by Ang II as in Figure 2A. B) Echocardiographic images from each group in mice. C,D) Echocardiographic analysis of ejection fraction (EF) and fractional shortening (FS). E) Gross‐heart from each group. F) The ratio of heart weight (HW) to body weight (BW). G) The ratio of heart weight (HW) to tibial length (TL). H) HE stained images of heart sections. Scale bar, 2.5 mm and 50 µm. I,J) Representative wheat germ agglutinin (WGA) stained images of heart sections. Scale bar, 50 µm (I) and quantitative analysis (J). K,L) Representative masson stained images of myocardial interstitium in heart sections. Scale bar, 50 µm (K) and quantitative analysis (L). M) RT‐qPCR analysis of Myh7 and Nppa in heart tissues. n = 6. ns., no significance, *p < 0.05, ** p < 0.01, and ***p < 0.001.
Figure 8
Figure 8
USP20 ameliorates cardiac hypertrophy and dysfunction by inhibiting STAT3. A) USP20 CKO mice were implanted with Ang II‐infused osmotic mini‐pump for 4 weeks. During this period, STAT3 inhibitor stattic was administered every day (10mg kg−1, qd). B) Representative M‐mode echocardiographic images from each group in mice. C,D) Echocardiographic analysis of ejection fraction (EF) and fractional shortening (FS). E) Representative images of gross‐heart from each group. F) The ratio of heart weight (HW) to body weight (BW). G) The ratio of heart weight (HW) to tibial length (TL). H) HE stained images of heart sections. Scale bar, 2.5 mm and 50 µm. I,J) Wheat germ agglutinin (WGA) stained images of heart sections. Scale bar, 50 µm (I) and quantitative analysis (J). K,L) Representative masson stained images of myocardial interstitium in heart sections. Scale bar, 50 µm (K) and quantitative analysis (L). M) RT‐qPCR analysis of Myh7 and Nppa in heart tissues. n = 6. **p < 0.01, ***p < 0.001, n.s., no significance.

Similar articles

References

    1. Shimizu I., Minamino T., J. Mol. Cell. Cardiol. 2016, 97, 245. - PubMed
    1. Metra M., Teerlink J. R., Lancet 2017, 390, 1981. - PubMed
    1. Feng J., Zhang Y., Zhang J., JACC Asia 2024, 4, 249. - PMC - PubMed
    1. Maron B. J., Rowin E. J., Maron M. S., Annu. Rev. Med. 2022, 73, 363. - PubMed
    1. Tham Y. K., Bernardo B. C., Ooi J. Y., Weeks K. L., McMullen J. R., Arch. Toxicol. 2015, 89, 1401. - PubMed

Substances

LinkOut - more resources