. 2025 Apr 1;66(4):14.
doi: 10.1167/iovs.66.4.14.

Nicotinamide Riboside Mitigates Retinal Degeneration by Suppressing Damaged DNA-Stimulated Microglial Activation and STING-Mediated Pyroptosis

Affiliations

Nicotinamide Riboside Mitigates Retinal Degeneration by Suppressing Damaged DNA-Stimulated Microglial Activation and STING-Mediated Pyroptosis

Shanshan Zhu et al. Invest Ophthalmol Vis Sci. .

Abstract

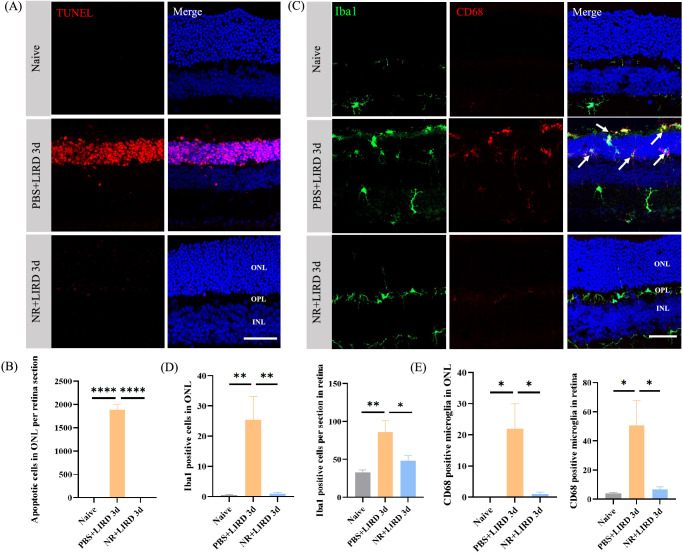
Purpose: Microglial activation plays a pivotal role in the pathogenesis of retinal degeneration, contributing to neuroinflammation within the retina. Previous studies identified that nicotinamide riboside (NR) mitigated light-induced retinal degeneration (LIRD) and inhibited microglial activation. The cGAS-STING signaling pathway has been recognized as a key mediator of inflammation in response to cellular stress and tissue damage. This study further explores the regulatory impact of NR on microglial activation and STING-mediated pyroptosis in retinal degeneration.

Methods: Balb/c mice were subjected to bright light exposure to induce retinal degeneration. Bioinformatics analysis was used to identify the upregulated key genes and signaling pathways involved in the progression of retinal degeneration, based on mouse transcriptomes from the LIRD model. Molecular biology techniques and immunofluorescence staining were used to assess cGAS-STING activation and expression of pyroptosis-associated molecules. Retinal function, photoreceptor apoptosis and inflammatory response were evaluated in the presence and absence of NR supplementation.

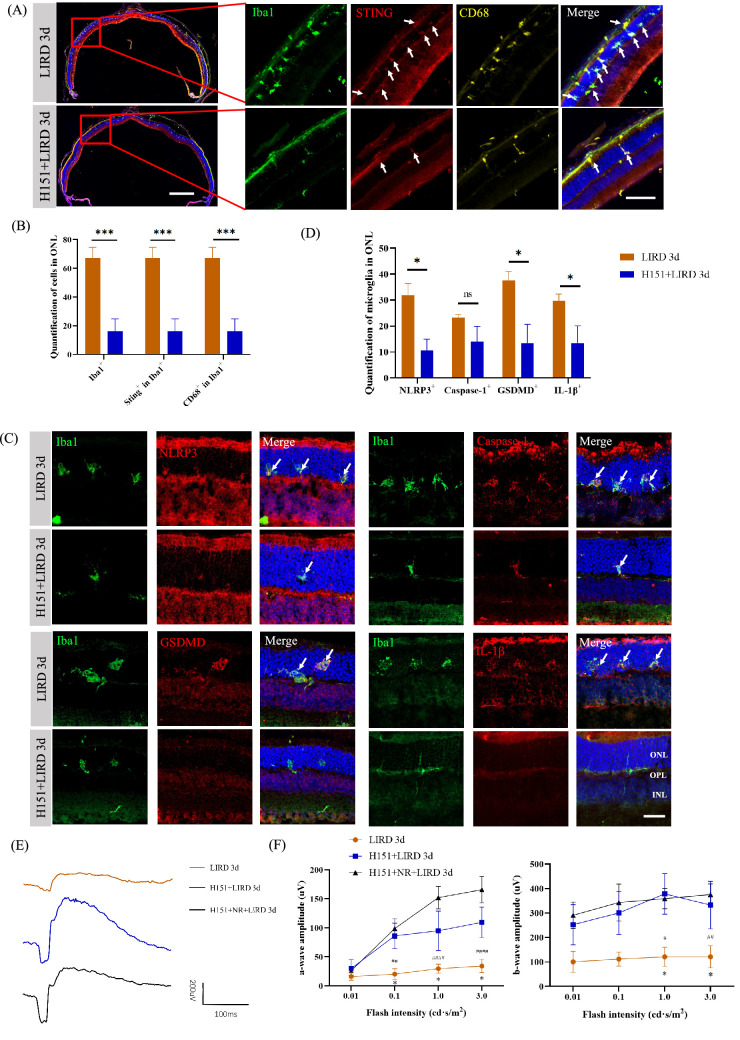
Results: Exposure to bright light resulted in mitochondrial dysfunction and the release of dsDNA, significantly triggering the activation of cGAS-STING pathway and microglial pyroptosis. In contrast, NR treatment preserved mitochondrial biosynthesis, inhibited STING expression in reactive microglia, and dampened the pro-inflammatory response. Additionally, intraperitoneal administration of the STING inhibitor H151 reduced light-induced microglial activation and pyroptosis, while improving retinal function and promoting photoreceptor survival.

Conclusions: These findings suggest that NR confers neuroprotection by attenuating damaged DNA-triggered STING-mediated microglial activation and pyroptosis. Targeting the cGAS-STING pathway presents a promising therapeutic avenue for retinal degeneration.


Conflict of interest statement

Disclosure: S. Zhu, None; L. Zhang, None; P. Tong, None; J. Chen, None; C. Wang, None; Z. Wang, None; J. Liu, None; P. Duan, None; Q. Jiang, None; Y. Zhou, None; G. Tan, None; X. Zhang, None; B. Jiang, None

Figures

Figure 1.
Figure 1.
Photoreceptor apoptosis and microglial activation in the LIRD mouse model. (A) Apoptotic cells in the ONL were identified by TUNEL staining. Representative images of apoptotic cells in frozen retinal sections at one, three, five, and seven days after light exposure. Scale bar: 30 µm. (B) Statistical graph of TUNEL positive cells in ONL of each group (n = 4–6/group). (C) Gene ontology (GO) enrichment analysis of the top 30 DEGs ranked by P value. BP, Biological process; MF, molecular function; CC, cellular component. (D) KEGG pathway enrichment analysis of the DEGs. Rich factor represents the ratio of the number of enriched DEGs in the KEGG category to the total genes in that category. (E) Activated microglia and cell nuclei were identified using Iba1 and DAPI staining, respectively. Representative images showing microglial activation at one, three, five, and seven days after light exposure. Scale bar: 50 µm. (F) Quantification of Iba1-positive cells across the whole retina, ONL, OPL and IPL at different time points after light exposure (n = 6/group). *P < 0.05, **P < 0.01, ***P < 0.001, ****P < 0.0001 versus naive group by one-way ANOVA with Tukey's multiple comparisons test. Error bars: SEM.
Figure 2.
Figure 2.
NR treatment inhibited apoptosis and microglial activation in the LIRD mouse model. (A) Representative morphologic images of each group, with TUNEL (red) labeling apoptotic cells and DAPI (blue) staining cell nuclei. Scale bar: 50 µm. (B) Quantification of TUNEL-positive nuclei in the ONL, counted from the entire retina (n = 5–6/group). Mice treated with NR exhibited significantly fewer TUNEL-positive cells compared to the PBS-treated group. (C) Representative images of Iba1-positive and CD68-positive (phagocytic microglia marker) cells in naive, PBS+LIRD3d, and NR+LIRD3d groups. Scale bar: 50 µm. (D) Quantification of Iba1-positive cells and (E) CD68-positive cells in both ONL and whole retina for each group at three days after light exposure (n = 4/group). NR treatment significantly suppressed microglia activation, compared with the PBS-treated group (n = 4/group). *P < 0.05, **P < 0.01, ****P < 0.0001 by one-way ANOVA with Tukey's multiple comparisons test.
Figure 3.
Figure 3.
NR treatment retained mitochondrial integrity and enhanced mitochondrial biogenesis in the LIRD mice. (A) Representative TEM images of mitochondria (upper panels; indicated magnification: 10kx.). Magnified images of single mitochondria from each group (lower panels). Scale bar: 1 µm. (B) Number of mitochondria per square micrometer (10–15 images per group). (C) Quantification of cristae number and (D) cristae score. 117–239 mitochondria per group. (E) QPCR analysis for PGC-1α, TFAM, mtDNA, and (F) SIRT1, UPC2 and UPC3 expression in naive, PBS + LIRD1d, and NR+LIRD1d groups (n = 4/group). *P < 0.05, **P < 0.01, by one-way ANOVA with Tukey‘s multiple comparisons test.
Figure 4.
Figure 4.
NR mitigated damaged DNA-stimulated cGAS-STING pathway. (A) Representative microscopic images of dsDNA immunopositivity (in red) and DAPI-counterstained nuclei (in blue). Scale bar: 50 µm. The boxed areas within the images were magnified and displayed in the right panels (arrowheads). Scale bar: 10 µm. (B) Colocalization of Tom20 (green), dsDNA (red), and DAPI (blue) expressions in retinas of each group (arrows). Scale bar: 10 µm. (C) Heatmap of cGAS and STING from RNA sequencing of naive and LIRD retinas with or without NR treatment (n = 4/group). (D) Colocalization of cGAS (red) and Iba1-positive microglia (green) expression in the retinas of each group (arrows). Scale bar: 30 µm. (E) Quantification of cGAS-positive microglia of each group in the ONL at three days after light exposure (n = 4–6/group). (F) Colocalization of STING (red) and Iba1-positive microglia (green) expression in the retinas of each group (arrows). Scale bar: 30 µm. (G) Quantification of STING-positive microglia of each group in the ONL at three days after light exposure (n = 5–6/group). NR treatment significantly decreased the expression of cGAS and STING compared with the PBS-treated group, ****P < 0.0001.
Figure 5.
Figure 5.
NR inhibited light-induced microglial pyroptosis. (A) Heatmap of NLRP3, caspase-1, GSDMD, IL-18, IL-1β, TNF-α, IL-6, and p-NF-κB from RNA sequencing of naive and LIRD retinas with or without NR treatment (n = 4/group). (B) The mRNA levels of pyroptosis-associated markers (n = 4–6/group) *P < 0.05, **P < 0.01, ***P < 0.001. (C) Colocalization of pyroptosis-related proteins (red) and Iba1 + microglia (green) in the retina sections in each group (arrows). Size marker: 50 µm. (D) Quantification of NLRP3+, caspase-1+, GSDMD+, and IL-1β+ in Iba1+ cells of each group in ONL at three days after light exposure. NR treatment significantly decreased the expression of pyroptosis-related proteins in the microglia compared with the PBS-treated group (n = 4–6/group). ****P < 0.0001, by one-way ANOVA with Tukey's multiple comparisons test.
Figure 6.
Figure 6.
STING deficiency attenuated light-induced microglial activation and protected against retinal degeneration. (A) Representative images of entire retinal section co-stained with Iba1 (green), STING (red), and CD68 (yellow) from LIRD mice with or without H151 treatment. Scale bar: 500 µm. Magnified single-plane images were shown on the right. Scale bar: 100 µm. (B) Quantification of Iba1+ cells, STING+ Iba1+ cells, and CD68+ Iba1+ cells of each group in ONL at three days after light exposure (n = 5/group). Phagocytic microglia (CD68+ Iba1+ cells) migrated to the ONL after light exposure, whereas STING deficiency reduced light-induced migration of phagocytic microglia. Arrows point to the colocalization of markers. *P < 0.05, **P < 0.01, ***P < 0.001, ****P < 0.0001, with unpaired t-test. (C) Colocalization of pyroptosis-related proteins (red) and Iba1+ microglia (green) in the retinal sections from each group. Scale bar: 30 µm. (D) Quantification of NLRP3+, Caspase-1+, GSDMD+, and IL-1β+ in Iba1+ cells in ONL at three days after light exposure (n = 5/group). (E) Representative ERG waveforms of a single eye from each group. (F) Scotopic ERG a-wave (left panel) and b-wave (right panel) mean amplitudes from LIRD mice treated with H151 or combination of H151 and NR (n = 4–5/group). Mice treated with H151 exhibited significantly higher a- and b-wave mean amplitudes (blue line) compared to the LIRD group (orange line). NR supplement (black line) did not add more protection to H151-treated retinas. Compared with the H151+LIRD group, *P < 0.05; Compared with the H151+NR+LIRD group, #P < 0.05, ##P < 0.01, ####P < 0.0001, by two-way ANOVA with Tukey's multiple comparisons test. Error bars: SEM.

References

    1. Fletcher EL. Mechanisms of photoreceptor death during retinal degeneration. Optom Vis Sci. 2010; 87: 269–275. - PubMed
    1. Gagliardi G, Ben M'Barek K, Goureau O. Photoreceptor cell replacement in macular degeneration and retinitis pigmentosa: a pluripotent stem cell-based approach. Prog Retin Eye Res. 2019; 71: 1–25. - PubMed
    1. Kaur G, Singh NK.. The role of inflammation in retinal neurodegeneration and degenerative diseases. Int J Mol Sci. 2021; 23: 386. - PMC - PubMed
    1. Yoshida N, Ikeda Y, Notomi S, et al. .. Clinical evidence of sustained chronic inflammatory reaction in retinitis pigmentosa. Ophthalmology. 2013; 120: 100–105. - PubMed
    1. Man SM, Kanneganti TD.. Converging roles of caspases in inflammasome activation, cell death and innate immunity. Nat Rev Immunol. 2016; 16: 7–21. - PMC - PubMed

MeSH terms