. 2025 Jun 13;31(12):2495-2514.
doi: 10.1158/1078-0432.CCR-24-3164.

Single-Cell Transcriptomic Landscape Deciphers Intratumoral Heterogeneity and Subtypes of Acral and Mucosal Melanomas

Affiliations

Single-Cell Transcriptomic Landscape Deciphers Intratumoral Heterogeneity and Subtypes of Acral and Mucosal Melanomas

Yunyan Li et al. Clin Cancer Res. .

Abstract

Purpose: To identify the specific intratumoral and microenvironmental heterogeneity of acral melanoma (AM) and mucosal melanoma (MM), we aimed to delineate their distinct cellular compositions, evolutionary trajectories, and subtype-specific therapeutic strategies.

Experimental design: Single-cell transcriptomic and genomic landscapes were analyzed across 42 melanoma (28 AM, 11 MM, and 3 nonacral cutaneous melanoma) samples, supplemented by in vitro and in vivo validation. Tumor and stromal cells were profiled using single-cell RNA sequencing, whole-exome sequencing, and functional assays, including transwell migration, co-culture systems, and xenograft models.

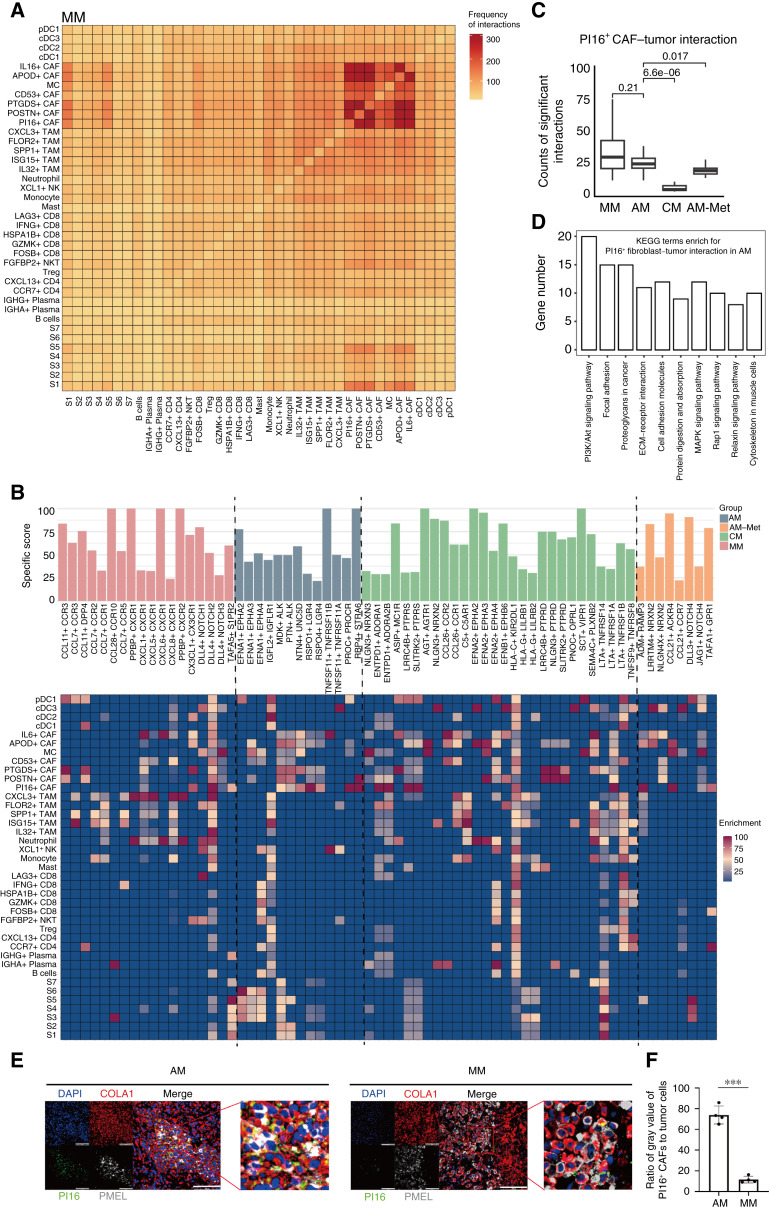
Results: Tumor cells exhibited divergent evolutionary routes, with MM dominated by MGP+/PCOLCE+ subpopulations showing high epithelial-to-mesenchymal transition potential. MM displayed elevated neutrophil infiltration and CXCL3+ tumor-associated macrophages, whereas AM was enriched with PI16+ cancer-associated fibroblasts promoting tumor proliferation. Molecular classification revealed MM subtypes: an antigen-presenting subtype linked to favorable outcomes and a proliferative subtype associated with recurrence. TIGIT+ regulatory T cells were enriched in AM, suggesting targeted inhibition potential. Genomic analysis connected BRAF/NRAS mutations to ALDOA+ stem-like tumor cells and identified prostaglandin D2 synthetase as a therapeutic target in triple-wild-type/melanomas.

Conclusions: Our study provides a comprehensive comparison of AM and MM, uncovering subtype-specific stromal-immune interactions and molecular programs. The findings highlight actionable targets (e.g., TIGIT in AM and CXCL3+ macrophages in MM) and propose a framework for precision therapies, biomarker-driven trials, and risk stratification to improve outcomes in these aggressive melanomas.


Conflict of interest statement

No disclosures were reported.

Figures

Figure 1.
Figure 1.
MM is dominated by MGP+ and PCOLCE+ S5 cells. A, Seven annotated melanoma molecular subtypes were classified by UMAP plot in AM, AM-Met, CM, and MM. B, Cluster-specific gene heatmap of each subtype. C, GSVA of these subtypes. D, Bar plot showing the population distribution of each subtype in AM, AM-Met, CM, and MM. E, Histogram illustrating the distribution of S5 subtype in AM, AM-Met, CM, and MM. The two-sided unpaired Student t test was used to identify significant difference. Error bars represent the mean ± SEM. F, KM overall survival curves comparing patients with high S5 scores (n = 222) with those with low S5 scores (n = 223). G, Pseudotime-ordered analysis (left) of these cell subtypes. Three cell fates were identified. Bar plot (right) showing the populations of each subtype in the different branches of the trajectory. H, Ridge plots displaying the dynamic changes in cell number along the pseudotime. I, Bar plot showing the proportions of S5 in the different branches of the trajectory. J, Two-dimensional plots showing the dynamic expression levels of MGP, PCOLCE, and SFRP1 genes over pseudotime in AM, AM-Met, CM, and MM. K, Flow cytometry plots showing EMT tumor cells from the control (Ctrl) and MGP overexpression (OE) cell line (n = 3). The bar plot displays EMT tumor cell proportions. Student t test. L, Transwell plot of MGP OE in A875 and A375 cell lines (left). The bar plot displays migrated tumor cell number (right).
Figure 2.
Figure 2.
TIGIT is a suitable inhibitor for AM. A, UMAP plot illustrating tumor-infiltrating lymphocytes (TIL) in AM, AM-Met, CM, and MM. Color coding by TIL subclusters. B, Bar plot displaying the population distribution of indicated subclusters in AM, AM-Met, CM, and MM. C, GSVA of selected hallmark pathways in these subclusters. D, Bar plot displaying the population distribution of indicated CD4+ T-cell subclusters (left) in AM, AM-Met, CM, and MM. Histogram (right) illustrating the percentage of subtype of T cells across these groups. The two-sided unpaired Student t test was used to identify the significant difference. Error bars represent the mean ± SEM. E and F, Representative IF images (E) and quantification (F) of FOXP3+CD4+ Tregs in AM and AM-Met. Quantification was based on a representative field of view. Scale bar, 50 μm. P value = 0.002; the assay was triplicated. The two-sided unpaired Student t test was used to identify the significant difference. Error bars represent the mean ± SD. G, Bar plot displaying the population distribution of indicated CD8+ T cells (left) in AM, AM-Met, CM, and MM. Histogram (right) illustrating the percentage of FOSB+ T cells in different types of melanoma. The two-sided unpaired Student t test was used to identify the significant difference. Error bars represent the mean ± SEM. H, Dot plot showing percent expression (pct.exp) and average expression (avg.exp) of TIGIT, CTLA4, TNFSF9, TNFSF4, and PDCD1 in AM, AM-Met, CM, and MM, respectively. I, Violin plots displaying the average expression of TIGIT and CTLA4 in the Tregs of AM, AM-Met, CM, and MM. ****, P < 0.0001; Kruskal–Wallis rank-sum test was used. J, RNA velocity analysis demonstrating the evolutionary trajectory of immunity cell subclusters. K, Violin plots displaying the cytotoxic scores (right) and exhausted scores (left) in AM, AM-Met, CM, and MM. ****, P < 0.0001; the Kruskal–Wallis rank-sum test was used.
Figure 3.
Figure 3.
Stronger infiltration of neutrophils and CXCL3+ tumor-associated macrophages in MM. A, UMAP plot of tumor-infiltrating myeloid cells (left) and their distribution (right) in AM, AM-Met, CM, and MM. B, Bar plot displaying the population distribution of specific subclusters within non-TAMs and TAMs across the AM, AM-Met, CM, and MM groups. C, Feature plots of classical marker genes for subcluster annotation. DC, dendritic cell; Mac, macrophage; Mono, monocyte. D, Pseudotime-ordered analysis of TAM subclusters. Arrows indicate the potential evolutionary direction in the trajectory. E, Feature plots showing the M1/M2 polarization signatures in TAMs. F, Violin plots illustrating the M1/M2 polarization signatures in the indicated TAM subclusters. Significance was determined using the Kruskal–Wallis rank-sum test. ****, P < 0.0001; ns, P > 0.05. G, Bar plot displaying the population distribution of indicated neutrophil (denominator is non-TAM) and CXCL3+ TAM (denominator is TAM) in AM, AM-Met, CM, and MM. The two-sided unpaired Student t test was used to identify the significant difference. Error bars represent the mean ± SEM. H and I, Representative IF image (H) and quantification (I) of MPO+ cells in formalin-fixed, paraffin-embedded tissues of MM and AM. MPO positive indicates neutrophil cells. Cells were stained with anti-MPO (green) and DAPI (4',6-diamidino-2-phenylindole; blue). Quantification was based on the average gray value within a representative field of view. Scale bar, 100 μm. P = 0.0033; the two-sided unpaired Student t test was used to identify the significant difference. Error bars represent the mean ± SD. J and K, Co-culture system of neutrophil, CD8+ T cells, and tumor cell line (A375 and A875). J, The bar plot shows the count of melanoma cells. K, Three repeated experiments; the two-sided unpaired Student t test was used to identify the significant difference. Error bars represent the mean ± SD. DC, dendritic cells. [J, Created in BioRender. Li, Y. (2025), https://BioRender.com/d18n133.]
Figure 4.
Figure 4.
PI16+ CAF is more abundant in AM and AM-Met than in CM and MM. A, UMAP plot of CAFs (left) and their distribution (right) in AM, AM-Met, CM, and MM. B, Dot plot showing the percentage expression (pct.exp) and average expression (avg.exp) level of marker genes in these subclusters. C, Bar plot displaying the population distribution of indicated subclusters in AM, AM-Met, CM, and MM. D, Histogram illustrating the populations of neutrophils in AM, AM-Met, CM, and MM. The two-sided unpaired Student t test was used to identify significant difference. Error bars represent mean ± SEM. E, GSVA of selected hallmark pathways in these subclusters. F, Visualization of the cell embedding landscape inferred by Monocle3 (left). Subtypes are labeled by colors (right). G and H, Representative IF images (G) and quantification (H) of PI16+VIM+ CAFs in fixed, paraffin-embedded tissues of MM and AM. Cells were stained with anti-COLA1 (red), anti-PI16 (green), and DAPI (4',6-diamidino-2-phenylindole; blue). Quantification was based on a representative field of view. Scale bar, 100 μm. P = 0.0010; the two-sided unpaired Student t test was used to identify the significant difference. Error bars represent the mean ± SEM. I, Co-culture system of PI16+CAF and melanoma cells. The bar plot shows the OD (optical density) value of the CKK-8 trial (down). The Student t test was used to identify significant difference. J, Growth curve for xenograft experiments with indicated tumor cells mixed with PI16 overexpression in fibroblasts inoculated subcutaneously into the flanks of nude mice (A875) and C57BL mice (B16). Visible tumors were measured every 3 days. Data are mean ± SEM relative to the control group (n = 5).
Figure 5.
Figure 5.
Strong interactions among melanoma cells and stromal cells were observed in MM. A, Heatmaps of cell–cell interaction in MM. B, Bar plot (top) showing subtype-specific LR pairs in MM, AM, AM-Met, and CM, and heatmap (bottom) showing the enrichment of these LR pairs in cell clusters. C, Boxplot of cell–cell interaction between PI16+ fibroblasts and melanoma cells. P values were calculated using the Wilcoxon rank-sum test. D, Kyoto Encyclopedia of Genes and Genomes (KEGG) enriched functional terms of the genes mediating interactions between PI16+ fibroblasts and melanoma cells. ECM, extracellular matrix. E and F, IF staining indicating co-localization (E) and quantification ratio (F) of PI16+ fibroblasts and melanoma cells in AM and MM. Cells were stained with anti-COLA1 (red), anti-PI16 (green), anti-PMEL (white), and DAPI (4',6-diamidino-2-phenylindole; blue). Quantification was based on a representative field of view. Scale bar, 100 μm. P = 0.00028.
Figure 6.
Figure 6.
Stem-like subtype cells; S6 of melanoma plays an important role in melanoma with driver mutant. A, Landscape of somatic alterations. B, Bar plot displaying the population distribution of seven melanoma subtypes within the triple-WT, BRAF, NRAS, and NF1 mutation groups. C, Histogram illustrating the populations of S6 subtype in AM, AM-Met, CM, and MM groups. The two-sided unpaired Student t test was used to identify the significant difference. Error bars represent mean ± SEM. D, Enriched functional terms of mutation and triple-WT. E, Volcano plot indicating differentially expressed genes (DEG) of S6 in the annotated mutation cells. F, CCK-8 trial after knocking down the DEGs. The bar plot shows the OD (optical density) value of the CKK-8 trial. G and H, Growth curve (G), tumor weight (H), and dissected tumors (H) for the xenograft experiments with indicated cells inoculated subcutaneously into the flanks of nude mice. Visible tumors were measured every 3 days. Data are mean ± SEM relative to the control group (n = 5).
Figure 7.
Figure 7.
Distinct molecular classifications of MM. A, Heatmaps of NMF analysis in AM. Bar plots displaying the representative Gene Ontology (GO) pathway terms enriched in each NMF MP. B, Heatmaps of NMF analysis in CM. Bar plots displaying the representative GO pathway terms enriched in each NMF MP. C, Heatmaps of NMF analysis in MM. Bar plots displaying the representative GO pathway terms enriched in each NMF MP. D, Patients with MM based on MP1 and MP2 scores, as well as no evidence of disease (NED) and recurrence. E, Boxplots illustrating the MP1 score of NED and recurrence group. F, KM analysis (right) showing the overall survival rate of patients with MM with the high-risk group (low MP1 score and high MP2 score) and the low-risk group (other) using the two-sided log-rank test. BP, biological process; CC, cell component; MF, molecular function; P.adjust, P value adjusted.

References

    1. de Visser KE, Joyce JA. The evolving tumor microenvironment: from cancer initiation to metastatic outgrowth. Cancer Cell 2023;41:374–403. - PubMed
    1. Kalaora S, Nagler A, Wargo JA, Samuels Y. Mechanisms of immune activation and regulation: lessons from melanoma. Nat Rev Cancer 2022;22:195–207. - PubMed
    1. Bald T, Quast T, Landsberg J, Rogava M, Glodde N, Lopez-Ramos D, et al. Ultraviolet-radiation-induced inflammation promotes angiotropism and metastasis in melanoma. Nature 2014;507:109–13. - PubMed
    1. Newell F, Johansson PA, Wilmott JS, Nones K, Lakis V, Pritchard AL, et al. Comparative genomics provides etiologic and biological insight into melanoma subtypes. Cancer Discov 2022;12:2856–79. - PMC - PubMed
    1. Lian B, Cui CL, Zhou L, Song X, Zhang XS, Wu D, et al. The natural history and patterns of metastases from mucosal melanoma: an analysis of 706 prospectively-followed patients. Ann Oncol 2017;28:868–73. - PubMed

MeSH terms

Substances