

Single-cell transcriptomics reveals immunosuppressive microenvironment and highlights tumor-promoting macrophage cells in Glioblastoma
- PMID: 40193323
- PMCID: PMC11975071
- DOI: 10.1371/journal.pone.0312764
Single-cell transcriptomics reveals immunosuppressive microenvironment and highlights tumor-promoting macrophage cells in Glioblastoma
Abstract
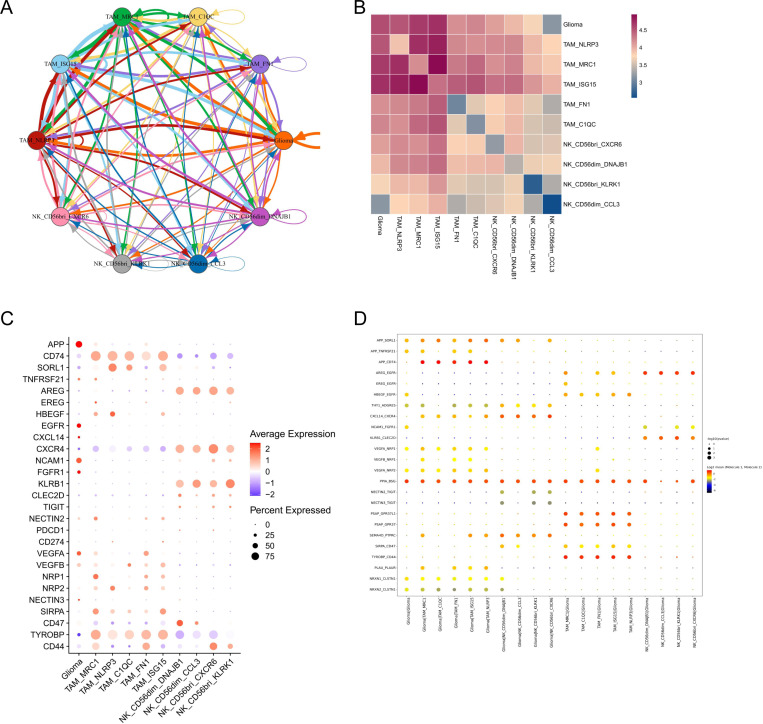
Glioblastoma (GBM) is the most prevalent and aggressive primary brain malignancy in adults. Nevertheless, the cellular heterogeneity and complexity within the GBM microenvironment (TME) are still not fully understood, posing a significant obstacle in the advancement of more efficient immunotherapies for GBM. In this study, we conducted an integrated analysis of 48 tumor fragments from 24 GBM patients at the single-cell level, uncovering substantial molecular diversity within immune infiltrates. We characterized molecular signatures for five distinct tumor-associated macrophages (TAMs) subtypes. Notably, the TAM_MRC1 subtype displayed a pronounced M2 polarization signature. Additionally, we identified a subtype of natural killer (NK) cells, designated CD56dim_DNAJB1. This subtype is characterized by an exhausted phenotype, evidenced by an elevated stress signature and enrichment in the PD-L1/PD-1 checkpoint pathway. Our findings also highlight significant cell-cell interactions among malignant glioma cells, TAM, and NK cells within the TME. Overall, this research sheds light on the functional heterogeneity of glioma and immune cells in the TME, providing potential targets for therapeutic intervention in this immunologically cold cancer.
Copyright: © 2025 Cheng et al. This is an open access article distributed under the terms of the Creative Commons Attribution License, which permits unrestricted use, distribution, and reproduction in any medium, provided the original author and source are credited.
Conflict of interest statement
The authors have declared that no competing interests exist.
Figures


Similar articles
-
Expression profiling of single cells and patient cohorts identifies multiple immunosuppressive pathways and an altered NK cell phenotype in glioblastoma.Clin Exp Immunol. 2020 Apr;200(1):33-44. doi: 10.1111/cei.13403. Epub 2019 Dec 16. Clin Exp Immunol. 2020. PMID: 31784984 Free PMC article.
-
Single-Cell Atlas Reveals Complexity of the Immunosuppressive Microenvironment of Initial and Recurrent Glioblastoma.Front Immunol. 2020 May 7;11:835. doi: 10.3389/fimmu.2020.00835. eCollection 2020. Front Immunol. 2020. PMID: 32457755 Free PMC article.
-
The FKBP51s Splice Isoform Predicts Unfavorable Prognosis in Patients with Glioblastoma.Cancer Res Commun. 2024 May 16;4(5):1296-1306. doi: 10.1158/2767-9764.CRC-24-0083. Cancer Res Commun. 2024. PMID: 38651817 Free PMC article.
-
Macrophages and microglia: the cerberus of glioblastoma.Acta Neuropathol Commun. 2021 Mar 25;9(1):54. doi: 10.1186/s40478-021-01156-z. Acta Neuropathol Commun. 2021. PMID: 33766119 Free PMC article. Review.
-
Microglia and macrophages in glioblastoma: landscapes and treatment directions.Mol Oncol. 2024 Dec;18(12):2906-2926. doi: 10.1002/1878-0261.13657. Epub 2024 May 7. Mol Oncol. 2024. PMID: 38712663 Free PMC article. Review.
Cited by
-
Integrating Single-Cell and Bulk RNA Sequencing Reveals the Malignant Phenotype of CBX4 in Prostate Cancer.J Cancer. 2025 Jul 28;16(11):3525-3536. doi: 10.7150/jca.115613. eCollection 2025. J Cancer. 2025. PMID: 40861818 Free PMC article.
References
-
- Omuro A, Brandes AA, Carpentier AF, Idbaih A, Reardon DA, Cloughesy T, et al.. Radiotherapy combined with nivolumab or temozolomide for newly diagnosed glioblastoma with unmethylated MGMT promoter: An international randomized phase III trial. Neuro Oncol. 2023;25(1):123–34. doi: 10.1093/neuonc/noac099 - DOI - PMC - PubMed
-
- Lim M, Weller M, Idbaih A, Steinbach J, Finocchiaro G, Raval RR, et al.. Phase III trial of chemoradiotherapy with temozolomide plus nivolumab or placebo for newly diagnosed glioblastoma with methylated MGMT promoter. Neuro Oncol. 2022;24(11):1935–49. doi: 10.1093/neuonc/noac116 - DOI - PMC - PubMed
MeSH terms
LinkOut - more resources
Full Text Sources
Medical
Research Materials
Miscellaneous
