. 2025 Apr 7;23(4):e3003077.
doi: 10.1371/journal.pbio.3003077. eCollection 2025 Apr.

The SPFH complex HflK-HflC regulates aerobic respiration in bacteria

Affiliations

The SPFH complex HflK-HflC regulates aerobic respiration in bacteria

María Isabel Pérez-López et al. PLoS Biol. .

Abstract

The bacterial HflK-HflC membrane complex is a member of the highly conserved family of SPFH proteins, which are present in all domains of life and include eukaryotic stomatins, flotillins, and prohibitins. These proteins organize cell membranes and are involved in various processes. However, the exact physiological functions of most bacterial SPFH proteins remain unclear. Here, we report that the HflK-HflC complex in Escherichia coli is required for growth under high aeration. The absence of this complex causes a growth defect at high oxygen levels due to a reduced abundance of IspG, an essential iron-sulfur cluster enzyme in the isoprenoid biosynthetic pathway. This reduction might be related to lower stability of IspG and several other proteins, including the iron siderophore transporter TonB, in the absence of the HflK-HflC complex. Our results suggest that decreased IspG activity leads to lower levels of ubiquinone and misregulated expression of multiple respiratory enzymes, including cytochrome oxidases, and consequently reduced respiration and lower ATP levels. This impact of the hflK hflC deletion on aerobic respiration resembles the mitochondrial respiratory defects caused by the inactivation of prohibitins in mammalian and yeast cells, indicating functional parallels between these bacterial and eukaryotic SPFH proteins.


Conflict of interest statement

The authors have declared that no competing interests exist.

Figures

Fig 1
Fig 1. HflKC complex is important for E. coli growth under high aeration.
(A–D) Growth of E. coli ΔhflKC, ΔhflK, and ΔhflC strains and corresponding WT in TB medium at 100 rpm (A), 220 rpm (B), or 300 rpm (C) shaking rate, quantified by optical density at 600 nm (OD600), and the final OD600 after 8 h of growth (D). (E, F) Growth of ΔhflKC and WT strains carrying either an empty vector (pBAD33) or the pBAD33-derived expression plasmid pMI93 encoding hflK and hflC, in TB at 220 rpm (E) and corresponding final OD600 after 8 h of growth (F). Where indicated, 0.05% L-arabinose was added to induce expression. (G, H) Growth of E. coli ΔhflK, ΔhflC, ΔhflKC, and WT strains in LB at 220 rpm (G) and corresponding final OD600 after 8 h of growth (H). For these and other growth curves, the data represent the mean and standard deviation (SD) of three independent cultures grown in the same representative experiment. Whenever not visible, error bars are smaller than the symbol size. See S1A–S1D Fig for additional biological replicates. For final OD600 comparisons, the data represent the mean and SD of independent cultures, indicated by dots, grown in three different experiments. Significance of indicated differences between samples: *p < 0.05, ***p < 0.001, and ns = not significant by unpaired t-test. All data underlying this figure can be found in S1 Data.
Fig 2
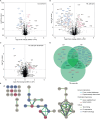
Fig 2. Absence of HflKC complex affects the abundance of respiration-related and other proteins.
(A–C) Difference in protein levels between ΔhflKC and WT strains. Cultures were grown in LB (A), TB (B), or anaerobically in TB (C). Data represent six (LB) or three (TB) independent cultures. Proteins with differences in expression that were considered significant (see Tables 1 and S1–S3) are labeled, with respiration-related proteins highlighted in either blue (downregulated) or red (upregulated). The underlying data can be found in S2 Data. (D) Commonalities and differences between proteins significantly up- or down-regulated in ΔhflKC under different conditions. Colors of protein labels are the same as in other panels. Respiration-related proteins and those affected under more than one condition are shown, and the number of other proteins affected under a particular condition is shown. (E) The STRING diagram showing proteins that are significantly up- or down-regulated in the ΔhflKC deletion strain. Links indicate specified types of relationships between proteins, with the interaction score confidence threshold of 0.4. Proteins related to respiration are colored in red (upregulated) or blue (downregulated).
Fig 3
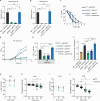
Fig 3. ΔhflKC strain shows reduced ubiquinone levels, aerobic respiration, and ATP levels.
(A) MEP pathway in E. coli. Metabolic intermediates are colored in light blue, and selected enzymes are shown on either dark blue (MEP pathway) or purple (ubiquinone biosynthesis) background. DXP: 1-deoxy-D-xylulose 5-phosphate; MEP: 2-C-methyl-D-erythritol 4-phosphate; ME-cPP: 2-C-methyl-D-erythritol 2,4-cyclic diphosphate; HMBPP: 1-hydroxy-2-methyl-2-(E)-butenyl 4-diphosphate; DMAPP: dimethylallyl diphosphate; IPP: isopentenyl diphosphate; and GGPP: geranylgeranyl diphosphate; 4-HB: 4-hydroxybenzoate. (B–D) Levels of the IspG substrate ME-cPP (B) and of ubiquinone-8 (C) and ubiquinol-8 (D) in ΔhflKC relative to the WT strain. Strains grown at 220 rpm in either M9 glucose minimal medium (B) or in TB (C, D). The data represent the mean and SD of three independent cultures. (E) Oxygen consumption by WT and ΔhflKC cells. The cultures were grown in TB at 220 rpm and resuspended in fresh TB, and changes in the levels of dissolved oxygen were quantified over time. Large symbols represent the mean and SD of eight independent measurements (shown by small dots) for cells from one culture. See also S4 Fig. (F) Levels of ROS in WT and ΔhflKC cells grown in TB at 220 rpm, measured using the DCF fluorescent probe as illustrated in S5 Fig. Treatment with hydrogen peroxide (H2O2) was used as a positive control for elevated ROS levels. The data represent the mean and SD of five measurements with 30,000 cells per measurement. (G) Membrane potential of WT and ΔhflKC cells grown in TB at 220 rpm, measured using the DiOC2(3) dye as illustrated in S6 Fig. DNP was used as a control. The data represent the mean and SD of 12 measurements from 2 independent experiments with 30,000 cells per measurement. (H) Levels of ATP, ADP, and AMP (H) in cells grown in M9 glucose minimal medium at 220 rpm. Means of three independent cultures and SD are shown. Significance of indicated differences between samples: *p < 0.05, **p < 0.01, ***p < 0.001, and ns = not significant by unpaired t-test. All data underlying this figure can be found in S3 Data.
Fig 4
Fig 4. Reduced IspG levels cause the respiratory phenotype of the
ΔhflKC strain. (A, B) Levels of ubiquinone-8 (A) and ubiquinol-8 (B) in the ΔhflKC strain, expressing IspG from an inducible plasmid vector, relative to the WT strain carrying pBAD33. The WT or ΔhflKC strains, transformed with empty vector pBAD33 or with pMI107 encoding ispG were grown in TB at 220 rpm; 0.02% L-arabinose was added to induce expression where indicated. The data represent the mean and SD of three independent cultures. (C) Oxygen consumption by the indicated strains. Measurements were performed as in Fig 3E. Large symbols represent the mean and SD of eight independent measurements for cells from one culture. See also S7A Fig. (D, E) Growth of the indicated strains (D) and corresponding final OD600 after 8 h of growth (E). The data in (D) represent the mean and SD of three independent cultures grown in the same representative experiment. The data in (E) represent the mean and SD of seven independent cultures, indicated by dots, grown in three different experiments. (F) Measurements of MP in the indicated strains, performed using the DiOC2(3) dye as in Fig 3G. Significance of indicated differences between samples: *p < 0.05, **p < 0.01, ***p < 0.001, and ns = not significant by unpaired t-test. (G, H) Abundance of IspG determined by proteomics in the WT or ΔhflKC cultures in LB at 220 rpm at indicated times after the inhibition of translation, represented as log2 protein intensity (G), and the same data normalized to the initial time point for each independent culture and plotted on a linear scale (H). (I, J) Abundance of TonB, determined and presented as in panels (G, H). The data in (G–J) represent the mean and SD of 18 independent cultures, measured in 3 different experiments with 6 cultures each. Significance of indicated differences between samples: **p < 0.01, ***< 0.001, and ns = not significant by unpaired t-test. All data underlying this figure can be found in S4 Data.

References

    1. Tavernarakis N, Driscoll M, Kyrpides NC. The SPFH domain: implicated in regulating targeted protein turnover in stomatins and other membrane-associated proteins. Trends Biochem Sci. 1999;24(11):425–7. doi: 10.1016/s0968-0004(99)01467-x - DOI - PubMed
    1. Hinderhofer M, Walker CA, Friemel A, Stuermer CAO, Möller HM, Reuter A. Evolution of prokaryotic SPFH proteins. BMC Evol Biol. 2009;9:10. doi: 10.1186/1471-2148-9-10 - DOI - PMC - PubMed
    1. Morrow IC, Parton RG. Flotillins and the PHB domain protein family: rafts, worms and anaesthetics. Traffic. 2005;6(9):725–40. doi: 10.1111/j.1600-0854.2005.00318.x - DOI - PubMed
    1. Browman DT, Hoegg MB, Robbins SM. The SPFH domain-containing proteins: more than lipid raft markers. Trends Cell Biol. 2007;17(8):394–402. - PubMed
    1. Boehm M, Nield J, Zhang P, Aro E, Komenda J, Nixon P. Structural and mutational analysis of band 7 proteins in the cyanobacterium Synechocystis sp. strain PCC 6803. J Bacteriol. 2009;191(20):6425–35. - PMC - PubMed

MeSH terms

LinkOut - more resources