. 2025 Mar 20;53(6):gkaf267.
doi: 10.1093/nar/gkaf267.

Two redox-responsive LysR-type transcription factors control the oxidative stress response of Agrobacterium tumefaciens

Affiliations

Two redox-responsive LysR-type transcription factors control the oxidative stress response of Agrobacterium tumefaciens

Janka J Schmidt et al. Nucleic Acids Res. .

Abstract

Pathogenic bacteria often encounter fluctuating reactive oxygen species (ROS) levels, particularly during host infection, necessitating robust redox-sensing mechanisms for survival. The LysR-type transcriptional regulator (LTTR) OxyR is a widely conserved bacterial thiol-based redox sensor. However, members of the Rhizobiales also encode LsrB, a second LTTR with potential redox-sensing function. This study explores the roles of OxyR and LsrB in the plant-pathogen Agrobacterium tumefaciens. Through single and combined deletions, we observed increased H2O2 sensitivity, underscoring their function in oxidative defense. Genome-wide transcriptome profiling under H2O2 exposure revealed that OxyR and LsrB co-regulate key antioxidant genes, including katG, encoding a bifunctional catalase/peroxidase. Agrobacterium tumefaciens LsrB possesses four cysteine residues potentially involved in redox sensing. To elucidate the structural basis for redox-sensing, we applied single-particle cryo-EM (cryogenic electron microscopy) to experimentally confirm an AlphaFold model of LsrB, identifying two proximal cysteine pairs. In vitro thiol-trapping coupled with mass spectrometry confirmed reversible thiol modifications of all four residues, suggesting a functional role in redox regulation. Collectively, these findings reveal that A. tumefaciens employs two cysteine-based redox sensing transcription factors, OxyR and LsrB, to withstand oxidative stress encountered in host and soil environments.


Conflict of interest statement

None declared.

Figures

Graphical Abstract
Graphical Abstract
Figure 1.
Figure 1.
Phylogeny and genomic localization of the LTTRs LsrB and OxyR. (A) Homology tree of representative LsrB (Q2YRP4, A9CI74, Q92PZ7) and OxyR (L7N677, Q9KNU4, Q7CPB9, P0ACQ4, A9CGX9, Q2YK31, Q92RT2, Q3J2P7, Q9A269) proteins from selected alphaproteobacteria, gammaproteobacteria and actinobacteria. LsrB is unique to the alphaproteobacterial order Rhizobiales. Homology tree was calculated by Clustal Omega [69] and visualized via iTol [70]. Tree scale (genetic distance) = 0.1. MTB = Mycobacterium tuberculosis. (B) Genomic context of lsrB and oxyR in representative species as in panel (A). Conserved genomic contexts are highlighted by asterisks.
Figure 2.
Figure 2.
Phenotypic effects of lsrB and oxyR deletion. Susceptibility to ROS of A. tumefaciens WT, ΔlsrB, ΔoxyR, and ΔlsrB/ΔoxyR was examined by (A) Inhibition zone analysis. Inhibition zone diameters in the presence of 1 M H2O2 or 200 μM paraquat. Error bars represent ± mean standard deviation (SD) of three biological replicates. (B) Spot assay. Cells were cultivated overnight, adjusted to an OD600nm of 0.5, serially diluted and spotted on LB plates supplied with the indicated stressor. Plates were documented after incubation at 30°C for 48 h. Images are representative for three independent replicates. (C) Cell motility analysis on AB, pH 5.5 soft-agar plates. ΔΔ = ΔlsrB/ΔoxyR. Error bars represent mean ± standard deviation of three biological replicates, with three technical replicates each. (D) Analysis of T-DNA transfer. A. thaliana Δefr1 seedlings were infected with A. tumefaciens strains carrying the vector pB1SN1 (GUS-reporter gene [54]). Successful transfer of T-DNA (here gusA) results in β-glucuronidase expression in infected plant tissue. Cleavage of the substrate X-Gluc by the β-glucuronidase stains the respective tissue blue. Activity was measured 3 days dpi. Experiment was performed in three biological replicates, with 10 technical replicates each. Significance was tested by one-way ANOVA. *P < .05, **P < .01, ***P < .001, ****P < .0001.
Figure 3.
Figure 3.
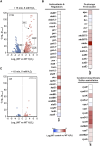
Transcriptomic response of A. tumefaciens WT to hydrogen peroxide stress. Agrobacterium tumefaciens WT strains were cultivated in LB medium until mid-exponential phase. Samples were withdrawn before (untreated) and after H2O2 treatment (“H2O2”) (A) Total number of differentially expressed genes in A. tumefaciens WT after hydrogen peroxide exposure (>2-fold, P < .01). Representative oxidative stress response genes are highlighted as dark-grey colored dots and labeled accordingly. (B) Heat map highlighting differentially regulated genes involved in the oxidative stress response (antioxidants, regulators, irons sequestration, or cysteine biosynthesis). (C) Total number of differentially regulated soluble RNA (sRNAs) in A. tumefaciens WT after H2O2 treatment.
Figure 4.
Figure 4.
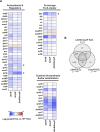
Effect of single or double deletion of lsrB and oxyR on the transcriptomic response to hydrogen peroxide stress. Strains were cultivated in LB medium until mid-exponential phase and collected before (untreated) and after H2O2 treatment (“H2O2”). (A) Heat map showing the expression of oxidative-stress associated genes in A. tumefaciens ΔlsrB, ΔoxyR, and ΔlsrB/ΔoxyR after H2O2 treatment. Expression of the regulator mutants is relative to H2O2-treated WT. (B) Comparison of the total number of differentially regulated genes between ΔlsrB, ΔoxyR, and ΔlsrB/ΔoxyR (>2-fold, P < .01). Asterisks highlight genes whose transcript levels were additionally examined by qRT-PCR (Supplementary Fig. S3 and Fig. 6).
Figure 5.
Figure 5.
Overlap of genes affected by hydrogen peroxide stress in the absence of LsrB or OxyR. The Venn diagrams represent the total number of differentially regulated genes (>2-fold, P < .01) overlapping between A. tumefaciens ΔlsrB or ΔoxyR before and after H2O2 treatment.
Figure 6.
Figure 6.
LsrB is the direct regulator of katG and oxyR. (A) Transcript levels of katG (atu4642) from cells grown in the LB medium to mid-exponential phase. Samples were collected before or after 15 min, 5 mM H2O2 exposure. Transcript levels were normalized to gyrB-levels. Error bars represent ± standard error of the mean of three independent replicates. (B) Binding of LsrB within the intergenic region of oxyR and katG, highlighted in orange. (C) DNA–protein interactions. A 125 bp fragment upstream of the katG CDS was labeled with 32P and incubated with increasing concentrations recombinantly purified LsrBHis or HisArgP (nonbinding control). Herring sperm was utilized as competitor DNA. The protein–DNA complex and free promoter DNA are labeled. Band shift assay was performed in three independent replicates, with one representative shown here.
Figure 7.
Figure 7.
Overexpression of katG in ΔlsrB and ΔoxyR mutants restores resistance to H2O2. (A) Western blot detection of plasmid-derived KatGHis in A. tumefaciens WT, ΔlsrB, ΔoxyR, and ΔlsrB/ΔoxyR strains. (B) Inhibition zone analysis in the presence of 1 M H2O2 after incubation at 30°C overnight. Error bars represent ± mean SD of three biological replicates. ΔΔ = ΔlsrB/ΔoxyR; EV = empty vector (pTrc200).
Figure 8.
Figure 8.
Figure 9.
Figure 9.
Phenotypic consequences of cysteine residue substitutions in LsrB. (A) Substitution of cysteine to serine was performed via site-directed mutagenesis on the lsrB-complementation plasmid. The resulting variants where phenotypically characterized by inhibition zone analysis in the presence of (B) 2 M H2O2, (C) 0.2 μM paraquat or (D) 100 mg ml ampicillin [37]. Error bars represent ± mean SD of three biological replicates. Significance was tested by one-way ANOVA (versus WT-EV). *P < .05, **P < .01, ***P < .001, ****P < .0001. EV = empty vector (pSRK).
Figure 10.
Figure 10.
Thiol-proteomics. (A) Recombinantly purified LsrBStrep was either left untreated for tryptic digest or was subjected to reduction via TCEP and modification of free thiols by MMTS. Peptides were detected via HDMSE (data-independent high-definition mass spectrometry). (B) Summary of detected MMTS modification after TCEP reduction. Peptide sequence and positions are given ibid. Experiments were performed in two independent replicates.
Figure 11.
Figure 11.
Regulation of the oxidative stress response in A. tumefaciens by two LTTRs. In response to ROS, the LTTRs LsrB and OxyR activate the transcription of key-antioxidant systems, ferritins, and cysteine biosynthesis. While the mechanism of OxyR as thiol-based redox sensor is well documented, our study uncovered that Agrobacterium LsrB acts a thiol-based redox switch, by utilizing redox-active cysteine residues for activation and is eventually re-reduced by the thioredoxin (Trx) or glutaredoxin system (Grx).

References

    1. Imlay JA The molecular mechanisms and physiological consequences of oxidative stress: lessons from a model bacterium. Nat Rev Micro. 2013; 11:443–54.10.1038/nrmicro3032. - DOI - PMC - PubMed
    1. Kaila VRI, Wikström M Architecture of bacterial respiratory chains. Nat Rev Micro. 2021; 19:319–30.10.1038/s41579-020-00486-4. - DOI - PubMed
    1. Imlay JA Cellular defenses against superoxide and hydrogen peroxide. Annu Rev Biochem. 2008; 77:755–76.10.1146/annurev.biochem.77.061606.161055. - DOI - PMC - PubMed
    1. Touati D Iron and oxidative stress in bacteria. Arch Biochem Biophys. 2000; 373:1–6.10.1006/abbi.1999.1518. - DOI - PubMed
    1. Bradley JM, Svistunenko DA, Wilson MT et al. . Bacterial iron detoxification at the molecular level. J Biol Chem. 2020; 295:17602–23.10.1074/jbc.REV120.007746. - DOI - PMC - PubMed

MeSH terms

LinkOut - more resources