. 2025 May;133(5):57024.
doi: 10.1289/EHP14876. Epub 2025 May 28.

Exposure to Long- and Short-Chain Per- and Polyfluoroalkyl Substances in Mice and Ovarian-Related Outcomes: An in Vivo and in Vitro Study

Affiliations

Exposure to Long- and Short-Chain Per- and Polyfluoroalkyl Substances in Mice and Ovarian-Related Outcomes: An in Vivo and in Vitro Study

Pawat Pattarawat et al. Environ Health Perspect. 2025 May.

Abstract

Background: The extensive use of per- and polyfluoroalkyl substances (PFAS) has led to environmental contamination and bioaccumulation of these substances. Previous research linked PFAS exposure to female reproductive disorders, but the mechanism remains elusive. Further, most studies focused on legacy long-chain PFOA and PFOS, yet the reproductive impacts of other long-chain PFAS and short-chain alternatives are rarely explored.

Objectives: We investigated the effects of long- and short-chain PFAS on the mouse ovary and further evaluated the toxic mechanisms of long-chain perfluorononanoic acid (PFNA).

Methods: A 3D in vitro mouse ovarian follicle culture system and an in vivo mouse model were used, together with approaches of reverse transcription-quantitative polymerase chain reaction (RT-qPCR), enzyme-linked immunosorbent assay (ELISA), RNA sequencing (RNA-seq), pharmacological treatments, in situ zymography, histology, in situ hybridization, analytical chemistry, and benchmark dose modeling (BMD). Using these approaches, a wide range of exposure levels (1-250μM) of long-chain PFAS (PFOA, PFOS, PFNA) and short-chain PFAS (PFHpA, PFBS, GenX) were first tested in cultured follicles to examine their effects on follicle growth, hormone secretion, and ovulation. We identified 250μM as the most effective concentration for further investigation into the toxic mechanisms of PFNA, followed by an in vivo mouse exposure model to verify the accumulation of PFNA in the ovary and its ovarian-disrupting effects.

Results: In vitro cultured ovarian follicles exposed to long- but not short-chain PFAS showed poorer gonadotropin-dependent follicle growth, ovulation, and hormone secretion in comparison with control follicles. RT-qPCR and RNA-seq analyses revealed significant alterations in the expression of genes involved in follicle-stimulating hormone (FSH)-dependent follicle growth, luteinizing hormone (LH)-stimulated ovulation, and associated regulatory pathways in the PFNA-exposed group in comparison with the control group. The PPAR agonist experiment demonstrated that a peroxisome proliferator-activated receptor gamma (PPARγ) antagonist could reverse both the phenotypic and genotypic effects of PFNA exposure, restoring them to levels comparable to the control group. Furthermore, in vivo experiments confirmed that PFNA could accumulate in ovarian tissues and validated the in vitro findings. The BMD, in vitro, and in vivo extrapolation analyses estimated follicular rupture as the most sensitive end point and that observed effects occurred in the range of human exposure to long-chain PFAS.

Discussion: Our study demonstrates that long-chain PFAS, particularly PFNA, act as a PPARγ agonist in granulosa cells to interfere with gonadotropin-dependent follicle growth, hormone secretion, and ovulation; and exposure to high levels of PFAS may cause adverse ovarian outcomes. https://doi.org/10.1289/EHP14876.


Figures

Figure 1 is a schematic representation of the ovarian toxicity assessment originating from a three-dimensional encapsulated in vitro follicle development system. Follicle maturation and ovarian steroidogenesis were seen in mice from days 0 to 6, followed by ovulation, oocyte meiosis, and luteinization, including alginate encapsulation and calcium chloride, from days 7 to 9. A flowchart has three Tiers. Tier 1: whole window exposure led to Tier 2. Tier 2: Specific window exposure led to Tier 3. Tier 3: Mechanism identification In vivo verification. Figure 1B is a set of six box and whiskers plot and six line graphs titled perfluorooctanoic acid, perfluorooctanesulfonic acid, Perfluorononanoic acid, Perfluoroheptanoic acid, Perfluorobutane sulfonate, GenX. The box and whiskers plots follicle diameter (micrometer), ranging from 100 to 400 in increments of 100 (y-axis) across day, ranging from 0 to 6 in increments of 2 (x-axis), respectively. The line graphs plots follicle diameter (micrometer), ranging from 100 to 400 in increments of 100 (y-axis) across day, ranging from 0 to 6 in increments of 2 (x-axis). Figure 1C is a stained tissue with seven columns, namely, control, perfluorooctanoic acid, perfluorooctanesulfonic acid, Perfluorononanoic acid, Perfluoroheptanoic acid, Perfluorobutane sulfonate, and GenX; and two rows, namely, day 0 and day 6 with 100 micrometers, respectively.
Figure 1.
A tiered ovarian toxicity testing and the effects of per- and polyfluoroalkyl substances (PFAS) on follicle growth. (A) The schematic of tiered ovarian toxicity testing starting from a 3D eIVFG system. (B) Effects of PFAS on follicle growth. Follicles were treated with either 0.1% DMSO as vehicle control, long-chain (PFOA, PFOS, and PFNA), or short-chain (PFHpA, PFBS, and GenX) at concentrations indicated from day 2. Average follicle diameter on day 6. n=1012 follicles in each treatment group. Data were analyzed using one-way ANOVA followed by a Tukey’s multiple comparisons test. (B) Shown on the line charts are mean±SD; whiskers above and below box plots indicate the lowest and highest values of data; asterisk indicates the significant difference between different PFAS concentration groups to the control group (vehicle); *p<0.05 and **p<0.01. (C) Representative follicle images on day 0 and day 6 of eIVFG treated with either vehicle or PFAS at 250μM, as indicated. Data represented in Figure 1B are included in Excel Table S9. Note: ANOVA, analysis of variance; DMSO, dimethylsulfoxide; eIVFG, encapsulated in vitro follicle growth; GenX, ammonium salt of HFPO-DA; hCG, human chorionic gonadotropin; HFPO-DA, hexafluoropropylene oxide dimer acid; PFAS, per- and polyfluoroalkyl substances; PFBA, perfluorobutane sulfonic acid; PFHpA, perfluoroheptanoic acid; PFNA, perfluorononanoic acid; PFOA, perfluorooctanoic acid; PFOS, perfluorooctane sulfonate; SD, standard deviation.
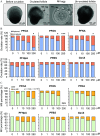
Figure 2A is a stained tissue with four columns, namely, before ovulation with 100 micrometers, ovulated follicle with 100 micrometers, metaphase 2 egg with 25 micrometers, and un-ovulated follicle with 100 micrometers. Figure 2B is a set of six stacked bar graphs titled perfluorooctanoic acid, perfluorooctanesulfonic acid, Perfluorononanoic acid, Perfluoroheptanoic acid, Perfluorobutane sulfonate, and GenX, plotting ovulation rate (percentage), ranging from 0 to 120 in increments of 20 (y-axis) across micrometers, ranging from 0 to 1 in unit increments, 1 to 10 in increments of 9, 10 to 100 in increments of 90, 100 to 250 in increments of 100 (x-axis) for ruptured and unruptured, respectively. Figure 2C is a set of six stacked bar graphs titled perfluorooctanoic acid, perfluorooctanesulfonic acid, Perfluorononanoic acid, Perfluoroheptanoic acid, Perfluorobutane sulfonate, and GenX, plotting ovulation rate (percentage), ranging from 0 to 120 in increments of 20 (y-axis) across micrometers, ranging from 0 to 1 in unit increments, 1 to 10 in increments of 9, 10 to 100 in increments of 90, 100 to 250 in increments of 100 (x-axis) for metaphase 2 and non- metaphase 2, respectively.
Figure 2.
Effects of exposure to long-chain and short-chain PFAS during the entire gonadotropin-dependent follicle maturation and ovulation window on follicle ovulation. (A) Representative images of follicles before and after hCG treatment, oocyte with polar body extrusion, and unruptured follicle after PFAS exposure. In vitro ovulation was induced by treating follicles with 1.5 IU/mL of hCG on day 6 of eIVFG for 14 h. (B,C) Percentages of ruptured and unruptured follicles (B) and ovulated MII oocytes (C) treated with various concentrations of long- and short-chain PFAS; n=10 follicles in each treatment group. Statistical analysis was done using Fisher’s exact test. Asterisk indicates the significant difference between different PFAS concentration groups to the control group (0μM); *p<0.05, **p<0.01, and ***p<0.001. Data represented in Figure 2A,B are included in Excel Table S10. Note: hCG, human chorionic gonadotropin; eIVFG, encapsulated in vitro follicle growth; MII, metaphase II; MII oocytes, oocytes with the first polar body extrusion; PFAS, per- and polyfluoroalkyl substances.
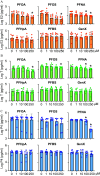
Figure 3A is a set of six stacked bar graphs titled perfluorooctanoic acid, perfluorooctanesulfonic acid, Perfluorononanoic acid, Perfluoroheptanoic acid, Perfluorobutane sulfonate, and GenX, plotting log estradiol (pictogram per meter), ranging from 3 to 5 in unit increments (y-axis) across micrometers, ranging from 0 to 1 in unit increments, 1 to 10 in increments of 9, 10 to 100 in increments of 90, 100 to 250 in increments of 100 (x-axis), respectively. Figure 3B is a set of six stacked bar graphs titled perfluorooctanoic acid, perfluorooctanesulfonic acid, Perfluorononanoic acid, Perfluoroheptanoic acid, Perfluorobutane sulfonate, and GenX, plotting log testosterone (pictogram per meter), ranging from 3 to 5 in unit increments (y-axis) across micrometers, ranging from 0 to 1 in unit increments, 1 to 10 in increments of 9, 10 to 100 in increments of 90, 100 to 250 in increments of 100 (x-axis), respectively. Figure 3C is a set of six stacked bar graphs titled perfluorooctanoic acid, perfluorooctanesulfonic acid, Perfluorononanoic acid, Perfluoroheptanoic acid, Perfluorobutane sulfonate, and GenX, plotting log progesterone (pictogram per meter), ranging from 3 to 6 in unit increments (y-axis) across micrometers, ranging from 0 to 1 in unit increments, 1 to 10 in increments of 9, 10 to 100 in increments of 90, 100 to 250 in increments of 100 (x-axis), respectively.
Figure 3.
Effects of PFAS exposure during the entire gonadotropin-dependent follicle maturation and ovulation window on ovarian steroidogenesis. (A,B) Bars represent the average log10 concentration (pg/mL) of estradiol (A) and testosterone (B) in the conditioned follicle culture media collected on day 6 of eIVFG. (C) Average log10 concentration (pg/mL) of progesterone in the conditioned follicle culture media collected on day 9 after hCG-stimulated follicles were cultured for 48 h. Data were analyzed with one-way ANOVA followed by a Tukey’s multiple comparisons test; n=510 follicles in each group. Bars represent mean±SD; asterisk indicates the significant difference between different PFAS concentration groups to the control group (0μM); *p<0.05 and **p<0.01. Data represented in Figure 3A,C are included in Excel Table S11. Note: ANOVA, analysis of variance; eIVFG, encapsulated in vitro follicle growth; hCG, human chorionic gonadotropin; PFAS, per- and polyfluoroalkyl substances; SD, standard deviation.
Figure 4A is a set of two stacked bar graphs titled Perfluorononanoic acid and GenX, plotting Ovulation rate (percentage), ranging from 0 to 120 in increments of 20 (y-axis) across micrometers, ranging from 0 to 1 in unit increments, 1 to 10 in increments of 9, 10 to 100 in increments of 90, 100 to 250 in increments of 100 (x-axis) for Ruptured and Unruptured, respectively. Figure 4B is a set of two stacked bar graphs titled Perfluorononanoic acid and GenX, plotting metaphase 2 percentage, ranging from 0 to 120 in increments of 20 (y-axis) across micrometers, ranging from 0 to 1 in unit increments, 1 to 10 in increments of 9, 10 to 100 in increments of 90, 100 to 250 in increments of 100 (x-axis) for metaphase 2 and non- metaphase 2, respectively. Figure 4C is a set of two stacked bar graphs titled Perfluorononanoic acid and GenX, plotting log progesterone (picogram per milliliter), ranging from 4 to 6 in increments of 0.5 (y-axis) across micrometers, ranging from 0 to 1 in unit increments, 1 to 10 in increments of 9, 10 to 100 in increments of 90, 100 to 250 in increments of 100 (x-axis), respectively. Figure 4D is a bar graph, plotting relative messenger ribonucleic acid expression, ranging from 0 to 4 in unit increments (y-axis) across Ccnd2, Pcna, Fshr, Lhcgr, Pappa, Inha, Inhba, Inhbb, Star, Cyp11a1, Cyp17a1, Cyp19a1, Hsd3b1, and Hsd17b1 (x-axis) for control and Perfluorononanoic acid.
Figure 4.
Effects of PFNA and GenX on follicle ovulation, resumption of oocyte meiosis, hormone secretion, and expression of follicle maturation genes. Follicles were exposed to various concentrations of PFNA or GenX from day 2 to 6 of eIVFG. (A,B) Percentages of ruptured and unruptured follicles (A) and ovulated MII oocytes (B) treated with various concentrations of PFNA or GenX. (C) Average log10 concentration (picograms per milliliter) of progesterone in the conditioned follicle culture media on day 9 after hCG-stimulated follicles were cultured for 48 h. (D) Relative mRNA expression of follicle maturation genes examined by RT-qPCR in single follicles treated with 250μM PFNA from day 2 to 6 of eIVFG. The mRNA expression levels were normalized by the expression of Gapdh. Data were analyzed with Student’s t-test. n=810 follicles in each group. Shown are mean±SD; asterisk indicates the significant difference between different PFAS concentration groups in comparison with the control group (0μM); *p<0.05 and **p<0.01. Data represented in Figure 4A,D are included in Excel Table S12. Note: eIVFG, encapsulated in vitro follicle growth; Gapdh, glyceraldehyde-3-phosphate dehydrogenase; GenX, ammonium salt of HFPO-DA; hCG, human chorionic gonadotropin; HFPO-DA, hexafluoropropylene oxide dimer acid; MII, metaphase II; MII oocytes, oocytes with the first polar body extrusion; PFAS, per- and polyfluoroalkyl substances; PFNA, perfluorononanoic acid; RT-qPCR, reverse transcription–quantitative polymerase chain reaction; SD, standard deviation.
Figure 5A is a Principal component analysis plot, plotting Principal component 2, 11.81 percent, ranging from negative 60 to 50 in increments of 30 (y-axis) across Principal component 1,45.47 percent, ranging from negative 60 to 50 in increments of 30 (x-axis) for control and Perfluorononanoic acid. Figure 5B is a volcano plot, plotting negative log to the base uppercase p, ranging from 0 to 50 in increments of 10 (y-axis) across negative log to the base 2 fold change, ranging from negative 5 to 5 in increments of 2.5 (x-axis) for up: 337, uppercase p less than 0.5, and down: 667. Figure 5C is a heatmap, plotting Hsd17b1, Hsd3b1, Cyp19a1, Cyp17a1, Cyp11a1, Star, Inhbb, Inhba, Inha, Pappa, Lhcgr, Fshr, Pcna, and Ccnd2 (y-axis) across control and Perfluorononanoic acid (x-axis). A scale depicts log to the base 2 (Transcripts Per Million plus 1) ranges from 2 to 10 in increments of 2. Figures 5D to 5G are dot plots titled biological process, cellular component, molecular function, and Kyoto Encyclopedia of Genes and Genomes, plotting Cytoskeleton organization, Microtubule-base process, DNA metabolic process, Regulation of cell cycle, Cell cycle, Microtubule cytoskeleton organization, Regulation of mitotic cell cycle, Cell cycle process, Mitotic cell cycle, Organelle fission; Cytoskeletal part, Microtubule cytoskeleton, Chromosome, Chromosomal part, Spindle, Chromosomal region, Chromosome centric region, Kinetochore, Condensed chromosome kinetochore, Condensed chromosome, centromeric region; Adenyl ribonucleotide binding, ATP binding, Drug binding, Pyrophosphatase activity, Kinase binding, Nucleoside-triphosphatase activity, Cytoskeletal protein binding, ATPase activity, Tubulin binding, Molecular binding; Glutamatergic synapse, Dilated cardiomyopathy, Progesterone-mediated oocyte maturation, Oocyte meiosis, p53 signaling pathway, Homologous recombination, Fanconi anemia pathway, Mismatch repair, Cell cycle, DNA replication (y-axis) across enrichment ratio, ranging from 2 to 6 in unit increments; 5 to 10 in increments of 5; 2 to 6 in unit increments; and 2 to 10 in increments of 4 (x-axis) for gene counts, ranging from 90 to 150 in increments of 30; 40 to 120 in increments of 20; 40 to 100 in increments of 20; and 25 to 100 in increments of 25. A scale depicts log to the base 2 (false discovery rate), ranging from 14 to 17 in unit increments, 14 to 17 in unit increments, 9 to 12 in unit increments, and 0 to 8 in increments of 2. Figure 5H is a set of one heatmap and one Venn diagram. The heatmap, plotting control and Perfluorononanoic acid (y-axis) across Single follicle ribonucleic acid -sequence data analysis (x-axis). A scale depicts row lowercase z score ranges from negative 2 to 2 in increments of 2. The Venn diagram displays two circles. The circle on the left is labeled cell cycle with 194 genes and the circle on the right is labeled 2654 genes. The intersection area is labeled 30 genes, including Ccnd2, Ccno, Cdc20, Cdc45, Cdk1, Cenph, Cep55, Chek1, Cpeb1, Cyp26b1, E2f8, Ercc6l, Gen1, Gmnn, Grb14, Jun, Mcm4, Mki67, Mybl1, Myc, Psrc1, Rad51b, Rad54l, Spc25, Trip13, Tuba4a, Ube2c, Brca1, Cdkn1a, Txnip.
Figure 5.
Single-follicle RNA-seq analysis of follicles exposed to PFNA during the FSH-stimulated follicle maturation window. (A) PCA of the first two PCs for follicles treated with PFNA at 250μM (n=9) or vehicle (n=10). (B) Volcano plot of DEGs; FDR <0.05; (absolute fold change 2 or 0.5) in PFNA-treated follicles in comparison with the control. Pink, red: up-regulated genes; black: insignificantly altered genes; light blue: down-regulated genes. (C) Heat map of the same set of follicle maturation-related genes examined by both single-follicle RNA-seq (here) and RT-qPCR. Each column in the heat map represents the relative difference of expression level in the genes for each sample. GO and KEGG pathway analysis of DEGs identified by single-follicle RNA-seq between follicles treated with PFNA at 250μM (n=9) or vehicle (n=10) during the follicle maturation window. (D–G) GO analyses of DEGs, including the top 10 enriched biological processes (D), the top 10 enriched cellular components (E), and the top 10 enriched molecular functions (F). (G) Top 10 enriched KEGG pathways. Data represent in Figure 5D–G are also presented in Excel Table S1. (H) Single-follicle RNA-seq data analysis comparing DEGs regulated by PFNA to PPAR target genes during follicle maturation window exposure. Heat map of DEGs in enriched process of “cell cycle” and their comparisons with predicted PPAR target genes from the PPAR gene database. Data represented in Figure 5C are included in Excel Table S13. Note: DEGs, differentially expressed gene; FDR, false discovery rate; FSH, follicle-stimulating hormone; GO, gene ontology; KEGG, Kyoto Encyclopedia of Genes and Genomes; PCA, principal component analysis; PFNA, perfluorononanoic acid; PPAR, peroxisome proliferator–activated receptor; RNA-seq, RNA sequencing; RT-qPCR, reverse transcription–quantitative polymerase chain reaction.
Figure 6A is a set of three box and whiskers plot and three line graphs. The box and whiskers plot, plotting follicle diameter (micrometer), ranging from 100 to 500 in increments of 100 (y-axis) across control, M K 866 0.1 micromolar, M K 866 1 micromolar, M K 866 10 micromolar, Perfluorononanoic acid 250 micromolar, Perfluorononanoic acid plus M K 886 0.1 micromolar, Perfluorononanoic acid plus M K 886 1 micromolar, and Perfluorononanoic acid plus M K 886 10 micromolar; control, G S K 3787 0.1 micromolar, G S K 3787 1 micromolar, G S K 3787 10 micromolar, Perfluorononanoic acid 250 micromolar, Perfluorononanoic acid plus G S K 3787 0.1 micromolar, Perfluorononanoic acid plus G S K 3787 1 micromolar, and Perfluorononanoic acid plus G S K 3787 10 micromolar; and control, G W 9662 0.1 micromolar, G W 9662 1 micromolar, G W 9662 10 micromolar, Perfluorononanoic acid 250 micromolar, Perfluorononanoic acid plus G W 9662 0.1 micromolar, Perfluorononanoic acid plus G W 9662 1 micromolar, and Perfluorononanoic acid plus G W 9662 10 micromolar (x-axis). The line graph, plotting follicle diameter (micrometer), ranging from 100 to 400 in increments of 100 (y-axis) across day, ranging from 0 to 6 in increments of 2 (x-axis) for control, M K 866 0.1 micromolar, M K 866 1 micromolar, M K 866 10 micromolar, Perfluorononanoic acid 250 micromolar, Perfluorononanoic acid plus M K 886 0.1 micromolar, Perfluorononanoic acid plus M K 886 1 micromolar, and Perfluorononanoic acid plus M K 886 10 micromolar; control, G S K 3787 0.1 micromolar, G S K 3787 1 micromolar, G S K 3787 10 micromolar, Perfluorononanoic acid 250 micromolar, Perfluorononanoic acid plus G S K 3787 0.1 micromolar, Perfluorononanoic acid plus G S K 3787 1 micromolar, and Perfluorononanoic acid plus G S K 3787 10 micromolar; and control, G W 9662 0.1 micromolar, G W 9662 1 micromolar, G W 9662 10 micromolar, Perfluorononanoic acid 250 micromolar, Perfluorononanoic acid plus G W 9662 0.1 micromolar, Perfluorononanoic acid plus G W 9662 1 micromolar, and Perfluorononanoic acid plus G W 9662 10 micromolar. Figure 6B is a set of three stacked bar graphs, plotting ovulation rate (percent), ranging from 0 to 120 in increments of 40 (y-axis) across M K 886 (micromolar), including 0 micromolar and 250 micromolar, each ranging from 0 to 0.1 in increments of 0.1, 0.1 to 1 in increments of 0.9, and 1 to 10 in increments of 9; G S K 3787 (micromolar), including 0 micromolar and 250 micromolar, each ranging from 0 to 0.1 in increments of 0.1, 0.1 to 1 in increments of 0.9, and 1 to 10 in increments of 9; and G W 9662 (micromolar), including 0 micromolar and 250 micromolar, each ranging from 0 to 0.1 in increments of 0.1, 0.1 to 1 in increments of 0.9, and 1 to 10 in increments of 9 (x-axis) for rupture and unrupture. Figure 6C is a set of six bar graphs. On the left, the three bar graphs, plotting log estradiol (picogram per milliliter), ranging from 3 to 6 in unit increments (y-axis) across control, M K 886, Perfluorononanoic acid, M K 886 plus Perfluorononanoic acid; control, G S K 3787, Perfluorononanoic acid, G S K 3787 plus Perfluorononanoic acid; and control, G S K 9662, Perfluorononanoic acid, G S K 9662 plus Perfluorononanoic acid (x-axis). On the right, the three bar graphs, plotting log testosterone (picogram per milliliter), ranging from 2 to 5 in unit increments (y-axis) across control, M K 886, Perfluorononanoic acid, M K 886 plus Perfluorononanoic acid; control, G S K 3787, Perfluorononanoic acid, G S K 3787 plus Perfluorononanoic acid; and control, G S K 9662, Perfluorononanoic acid, G S K 9662 plus Perfluorononanoic acid (x-axis). Figure 6D is a set of four bar graphs, plotting relative messenger ribonucleic acid expression, ranging from 0 to 60 in increments of 20 (y-axis) across control, G W 9662, Perfluorononanoic acid, G W 9662 plus Perfluorononanoic acid (x-axis) for Fshr, Cyp19a1, Hsd17b1, and Inhbb.
Figure 6.
The role of PPAR in the effect of PFNA on follicle maturation. (A,B) Follicles were treated with 0, 0.1, 10μM PPARα antagonist (MK886), PPARβ antagonist (GWK3787), or PPARγ antagonist (GW9662) as indicated, or 250μM PFNA, or both 0.110μM PPAR antagonists and 250μM PFNA, or vehicle from day 4 to day 6 of eIVFG. (A) Average diameters of follicles from day 0 to day 6. Insets: Average follicle diameter on day 6. Asterisk indicates the significant difference from different treatment groups to the control group (0μM); (B) Percentage of ruptured and unruptured follicles; asterisk indicates the significant difference between the cotreatment of PFNA and PPAR antagonist groups to the corresponding PPAR antagonist concentration groups; (C,D) Follicles were treated with 10μM PPAR antagonists or 250μM PFNA alone or in combination of both, or vehicle control from day 4–6 of eIVFG. (C) Average log10 concentration of estradiol and testosterone in the conditioned follicle culture media collected on day 6; asterisk indicates the significant difference between two connected groups. (D) Relative mRNA expression of follicle maturation genes examined by RT-qPCR (n=8) in follicles treated with vehicle, 10μM PPARγ antagonist (GW9662), 250μM PFNA, or both 10μM PPARγ antagonist (GW9662) and 250μM PFNA; asterisk indicates the indicate significant difference between two connected groups. Expression levels were normalized by the expression of Gapdh. Data were analyzed with Student’s t-test (A), Fisher’s exact test (B), and one-way ANOVA followed by a Tukey’s multiple comparisons test (C,D), n=810 follicles in each treatment group. Shown are mean±SD. Data represented in Figure 6 are included in Excel Table S14. Note: ANOVA, analysis of variance; eIVFG, encapsulated in vitro follicle growth; Gapdh, glyceraldehyde-3-phosphate dehydrogenase; PFNA, perfluorononanoic acid; PPAR, peroxisome proliferator–activated receptor; PPARα, peroxisome proliferator–activated receptor alpha; PPARβ, peroxisome proliferator–activated receptor lowercase beta; PPARγ, peroxisome proliferator–activated receptor lowercase gamma; RT-qPCR, reverse transcription–quantitative polymerase chain reaction; SD, standard deviation. *p<0.05; **p<0.01; and ***p<0.001.
Figure 7A is a stacked bar graph titled Perfluorononanoic acid and GenX, plotting ovulation (percent), ranging from 0 to 120 in increments of 20 (y-axis) across micromolar, ranging from 0 to 1 in unit increments, 1 to 10 in increments of 9, 10 to 100 in increments of 90, 100 to 250 in increments of 100 (x-axis) for ruptured and unruptured. Figure 7B is a stacked bar graph titled Perfluorononanoic acid and GenX, plotting metaphase 2 percentage, ranging from 0 to 120 in increments of 20 (y-axis) across micromolar, ranging from 0 to 1 in unit increments, 1 to 10 in increments of 9, 10 to 100 in increments of 90, 100 to 250 in increments of 100 (x-axis) for metaphase to non-metaphase. Figure 7C is a stacked bar graph titled Perfluorononanoic acid and GenX, plotting log progesterone (picogram per milliliter), ranging from 4 to 6 in increments of 0.5 (y-axis) across micromolar, ranging from 0 to 1 in unit increments, 1 to 10 in increments of 9, 10 to 100 in increments of 90, 100 to 250 in increments of 100 (x-axis). Figure 7D is a bar graph titled expression of ovulation related genes, plotting relative messenger ribonucleic acid expression, ranging from 0 to 3 in unit increments (y-axis) across Star, Cyp11a1, Cyp17a1, Hsd3b1, Cyp19a1, Pgr, Areg, Ereg, Btc, Has2, Ptgs2, Tnfaip6, Adamts1, Plat, Plau, and Il6 (x-axis) control and Perfluorononanoic acid. Figure 7E is a set of one stained tissue and one bar graph. The stained tissue has three columns, namely, 4′,6-diamidino-2-phenylindole, G F, and Merged; and two rows, namely, control and Perfluorononanoic acid with 100 micromolar. The bar graph, plotting M F I (times 10 begin superscript 5 end superscript), ranging from 0 to 300 in increments of 50 (y-axis) across control and Perfluorononanoic acid (x-axis) for fluorescent intensity.
Figure 7.
Effects of PFNA and GenX on follicle ovulation, expression of ovulatory genes, and gelatinase activity. Follicles were exposed to various concentrations of vehicle, PFNA, or GenX as well as 1.5 IU/mL hCG on day 6 of eIVFG for in vitro ovulation induction. (A) Percentages of ruptured and unruptured follicles treated with various concentrations of PFNA and GenX. (B) Percentage of ovulated MII oocytes. (C) Average log10 concentration (pg/mL) of progesterone in the conditioned follicle culture media after hCG-stimulated follicles were cultured for 48 h (n=8). (D) Relative mRNA expression of ovulation-related genes at 4 h of post-hCG treatment was examined by RT-qPCR. Expression data were normalized with the expression of Gapdh. (E) Representative images and quantification of in situ zymography of follicles treated with vehicle or PFNA at 14 h post hCG. Data were analyzed with Fisher’s exact test (A,B), and Student’s t-test (C–E). Shown bars represent mean±SD; n=810 follicles in each treatment group; asterisk indicates the significant difference from different treatment groups to the control group (0μM); *p<0.05; **p<0.01. Data represented in Figure 7 are included in Excel Table S15. Note: eIVFG, encapsulated in vitro follicle growth; Gapdh, glyceraldehyde-3-phosphate dehydrogenase; GenX, ammonium salt of HFPO-DA; hCG, human chorionic gonadotropin; HFPO-DA, hexafluoropropylene oxide dimer acid; MFI, mean fluorescent intensity; MII, metaphase II; MII oocytes, oocytes with the first polar body extrusion; PFNA, perfluorononanoic acid; RT-qPCR, reverse transcription–quantitative polymerase chain reaction; SD, standard deviation.
Figure 8A is a Principal component analysis plot, plotting Principal component 2, 7.63 percent, ranging from negative 50 to 50 in increments of 25 (y-axis) across Principal component 1, 68.33 percent, ranging from negative 50 to 50 in increments of 25 (x-axis) for control and Perfluorononanoic acid. Figure 8B is a volcano plot, plotting negative log to the base uppercase p, ranging from 0 to 200 in increments of 50 (y-axis) across negative log to the base 2 fold change, ranging from negative 10 to 10 in increments of 5 (x-axis) for up: 3103, uppercase p less than 0.05, and down: 1090. Figure 5C is a heatmap, plotting Fhsr, Cyp19a1, Ccnd2, Pgr, Runx1, Runx2, Areg, Ereg, Btc, Ctsl, Snap25, Prkg2, Has2, Tnfaip6, Ptgs2, Star, Cyp11a1, Hsd3b1, Il6, Ccl2, Cxcl2, Adamts1, Plat, Plau (y-axis) across control and Perfluorononanoic acid (x-axis). A scale depicts log to the base 2 (Transcripts Per Million plus 1) ranges from 2 to 12 in increments of 2. Figures 8D to 8G are dot plots titled biological process, cellular component, molecular function, and Kyoto Encyclopedia of Genes and Genomes, plotting Signal transduction, Lipid metabolic process, Cell differentiation, Multicellular organism development, Cell adhesion, Iron transport, Transmembrane transport, Positive regulation of E R K 1 and E R K 2 cascade, Angiogenesis, Adenylyl cyclase-activating G P C R signaling pathway; Protein binding, Nucleotide binding, Identical protein binding, Kinase activity, Calcium ion binding, Catalytic activity, Actin binding, Calmodulin binding, Growth factor activity, Ion channel activity; Cytoplasm, Membrane, Extracellular region, Cell junction, Dendrite, Neuronal cell body, Neuron projection, Cell surface, Cell projection, Extracellular matrix; Retinol metabolism, Viral protein interaction with cytokine and cytokine receptor, Drug metabolism – cytochrome P 450, Metabolism of xenobiotics by cytochrome P450, Ovarian steroidogenesis, Chemical carcinogenesis, Calcium signaling pathway, cAMP signaling pathway, Neuroactive ligand-receptor interaction, Cytokine-cytokine receptor interaction (y-axis) across enrichment ratio, ranging from 1.0 to 2.5 in increments of 0.5; 1.0 to 2.5 in increments of 0.5; 1.0 to 2.5 in increments of 0.5; and 10 to 30 in increments of 5 (x-axis) for gene counts, ranging from 100 to 300 in increments of 100; 250 to 1250 in increments of 250; 500 to 1500 in increments of 500; 50 to 125 in increments of 25, respectively. A scale depicts log to the base 10 (false discovery rate), ranging from 7 to 13 in increments of 2; 7.5 to 15.0 in increments of 2.5; 20 to 80 in increments of 20; and 4 to 10 in increments of 2. Figure 8H is a heatmap, plotting Tnfaip6, Ptgs2, Ptgs1, Il7, Il6, Il33, Il17a, Il11, Cxcr4, Cxcl5, Cxcl3, and Cxcl2 (y-axis) across control and Perfluorononanoic acid (x-axis). A scale depicts log to the base 2 ((Transcripts Per Million plus 1) ranges from 0 to 20 in increments of 5.
Figure 8.
Single-follicle RNA-seq analysis of follicles exposed to PFNA during the ovulation window only. (A–H) Follicles were treated with vehicle control or 250μM PFNA and 1.5 UI/mL hCG for 4 h on day 8 of eIVFG. (A) PCA of the first two principal components for follicles treated with PFNA (n=10) or vehicle control (n=11). (B) Volcano plot of differentially expressed genes (DEGs; FDR <0.05; absolute fold change >2 or <2) in PFNA-treated follicles in comparison with the control group. Pink, red: up-regulated genes; black: nonsignificantly altered genes; light blue: down-regulated genes. (C) Heat map indicating relative change of ovulatory genes in PFNA-treated follicles (column 12–21) and control (column 1–11). (D,F) GO analyses of DEGs, including the top 10 biological process enrichment results (D), the top 10 cellular component enrichment results (E), and the top 10 molecular function enrichment results (F). (G) Top 10 KEGG pathway enrichment results. (H) Heat map indicating relative change of inflammatory genes in PFNA-treated follicles (column 12–21) and control (column 1–11). Data presented in Figure 8C,H are included in Excel Table S16; Figure 8D,G data are included in Excel Table S2. Note: DEG, differentially expressed gene; eIVFG, encapsulated in vitro follicle growth; FDR, false discovery rate; GO, gene ontology; hCG, human chorionic gonadotrophin; KEGG, Kyoto Encyclopedia of Genes and Genomes; PCA, principal component analysis; PFNA, perfluorononanoic acid; RNA-seq, RNA sequencing.
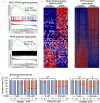
Figure 9A is a set of two Gene set enrichment analysis titled Kyoto Encyclopedia of Genes and Genomes peroxisome proliferator-activated receptor signaling pathway and peroxisome proliferator-activated receptor predicted target genes, plotting enrichment score, ranging from 0.0 to 0.4 in increments of 0.1 and negative 0.15 to 0.20 in increments of 0.05 and ranked list metric (signal 2 noise), ranging from negative 4 to 4 in increments of 2 (y-axis) across Rank in ordered dataset, ranging from 0 to 19000 in increments of 2000 (x-axis) for enrichment profile, hits, and ranking metric scores. Figure 9B is a set of two heatmap. On the left, a heatmap is titled Kyoto Encyclopedia of Genes and Genomes peroxisome proliferator-activated receptor signaling pathway genes, plotting relative difference of expression level of genes (y-axis) across control and Perfluorononanoic acid (x-axis). On the right, a heatmap is titled peroxisome proliferator-activated receptor predicted target genes, plotting relative difference of expression level of genes (y-axis) across control and Perfluorononanoic acid (x-axis). Figure 9C is a stacked bar graph, plotting ovulation rates (percent), ranging from 0 to 120 in increments of 20 (y-axis) across Perfluorononanoic acid, including M K 886 (micromolar), including 0 micromolar and 250 micromolar, each ranging from 0 to 0.1 in increments of 0.1, 0.1 to 1 in increments of 0.9, and 1 to 10 in increments of 9; G S K 3787 (micromolar), including 0 micromolar and 250 micromolar, each ranging from 0 to 0.1 in increments of 0.1, 0.1 to 1 in increments of 0.9, and 1 to 10 in increments of 9; and G W 9662 (micromolar), including 0 micromolar and 250 micromolar, each ranging from 0 to 0.1 in increments of 0.1, 0.1 to 1 in increments of 0.9, and 1 to 10 in increments of 9 (x-axis) for ruptured and unruptured. Figure 9D is a set of six bar graphs, plotting relative expression, ranging from 0 to 100 in increments of 20; 0 to 80 in increments of 20; 0 to 50 in increments of 10; 0 to 80 in increments of 20; 0 to 20 in increments of 5; and 0 to 15 in increments of 5 (y-axis) across control, G W 9662, Perfluorononanoic acid, and G W 9662 plus Perfluorononanoic acid (x-axis) for Star, Cyp11a1, Hsd3b1, Plau, Plat, and IL6. Figure 9E is a bar graph, plotting log progesterone (picogram per milliliter), ranging from 4.5 to 6.0 in increments of 0.5 (y-axis) across control, G W 9662, Perfluorononanoic acid, and G W 9662 plus Perfluorononanoic acid (x-axis) for Progesterone secretion.
Figure 9.
The role of PPAR in the effect of PFNA on follicle ovulation. (A) GSEA of DEGs, including KEGG PPAR signaling pathway gene sets and predicted PPAR target genes. (B) Heat map of genes in the KEGG PPAR signaling pathway and predicted PPAR target genes. Columns represent the relative difference of expression level of genes in each sample. (C) Follicles were treated with 0, 0.1, 1, 10μM PPAR antagonists, or 250μM PFNA, or combination of PPAR antagonists and PFNA, or vehicle control. Follicle rupture was then examined at 14 h post hCG and (n=10); asterisk indicates the significant difference between the cotreatment of PFNA and PPAR antagonist groups to the corresponding PPAR antagonist concentration groups. (D) Relative mRNA expression of ovulatory genes examined by RT-qPCR; follicles were treated with 10μM PPARγ antagonist (GW9662), 250μM PFNA, or a combination of both, or vehicle control with hCG for 4 h (n=8). The expression level of each gene was normalized by the expression of Gapdh. Asterisk indicates the significant difference between two connected groups. (E) Average log10 concentration of progesterone in conditioned ovulation-induction media collected 48 h post hCG (n=810); asterisk indicates the significant difference between two connected groups. Statistical analyses were done with Fisher’s exact test (B) and one-way ANOVA followed by a Tukey’s multiple comparisons test (C,D). Bars represent mean±SD. Data presented in Figure 9 are presented in Excel Table S17–S18. Note: ANOVA, analysis of variance; Gapdh, glyceraldehyde-3-phosphate dehydrogenase; GSEA, gene set enrichment analysis; hCG, human chorionic gonadotrophin; KEGG, Kyoto Encyclopedia of Genes and Genomes; PFNA, perfluorononanoic acid; PPAR, peroxisome proliferator–activated receptor; RT-qPCR, reverse transcription–quantitative polymerase chain reaction; SD, standard deviation. *p<0.05; **p<0.01; and ***p<0.001.
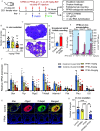
Figure 10A depicts a timeline with a schematic representation of the superovulation model and in vivo exposure to perfluorononanoic acid. This schematic depicts the experimental setup for a study using 21-day-old C D 1 female mice. The timeline involves five days. Days 1-5: Mice are given daily intraperitoneal (I P) injections of either 1 times P B S (control) or Perfluorononanoic acid at 1, 5, or 25 mg/kg body weight, as indicated by red arrows. Day 3: A blue arrow indicates the delivery of PMSG (Pregnant Mare Serum Gonadotropin), which promotes follicle development. Day 5: A green arrow denotes the delivery of human Chorionic Gonadotropin, which causes ovulation. Tissue and samples are obtained four and fourteen hours following the human Chorionic Gonadotropin injection. On the right, the graphic divides downstream analysis into two groups: Reproductive evaluations include ovulation induction, ovarian histology, follicle or oocyte count, and peroxisome proliferator-activated receptor antagonist medication. Molecular analyses include ultra-high performance liquid chromatography-high resolution mass spectrometry, reverse transcription-quantitative polymerase chain reaction, and in situ ribonucleic acid hybridization. Figure 10B is a bar graph, plotting number of oocyte, ranging from 0 to 60 in increments of 20 (y-axis) across milligram per kilogram Perfluorononanoic acid, ranging from 0 to 1 in unit increments, 1 to 5 in increments of 4, and 5 to 25 in increments of 20 (x-axis) for in vivo ovulation. Figure 10C is a stained tissue depicting ovary histology from mice treated with control and Perfluorononanoic acid 25 milligrams per kilogram. Figure 10D is a bar graph, plotting number of antral follicles, ranging from 0 to 30 in increments of 10 (y-axis) across control and 25 milligrams per kilogram Perfluorononanoic acid (x-axis) for Unruptured antral follicle counting. Figure 10E is a clustered bar graph, plotting Perfluorononanoic acid nanogram per ovary, ranging from 0 to 40 in increments of 10 and 150 to 250 in increments of 50 (left y-axis) and Perfluorononanoic acid microgram per milliliter serum, ranging from 0 to 50 in increments of 10 and 200 to 400 in increments of 50 (right y-axis) across Perfluorononanoic acid dose (milligram per kilogram per body weight), ranging from 0 to 1 in unit increments, 1 to 5 in increments of 4, and 5 to 25 in increments of 20 (x-axis) for Perfluorononanoic acid in vivo accumulation, including ovary, ovary F F, and serum. Figure 10F is a bar graph, plotting relative messenger ribonucleic acid expression, ranging from 0 to 60 in increments of 20 (y-axis) across Star, Pgr, Ptgs2, Tnfaip6, Adamts1, Plat, Plau, and Il6 (x-axis) for control 0 hour, post human Chorionic Gonadotropin; control 4 hours, post human Chorionic Gonadotropin, Perfluorononanoic acid-1 milligram per kilogram; Perfluorononanoic acid-5 milligrams per kilogram; and Perfluorononanoic acid-25 milligrams per kilogram. Figure 10G is a stained tissue that has four columns, namely, Star, Ptgs2, Tnfaip6, and Merged; and two rows, namely, control and Perfluorononanoic acid. Figure 10H is a bar graph, plotting number of oocyte, ranging from 0 to 60 in increments of 20 (y-axis) across control, G W 9662, Perfluorononanoic acid, and G W 9662 plus Perfluorononanoic acid (x-axis) for in vivo ovulation.
Figure 10.
Effects of PFNA on ovulation in a mouse superovulation model. (A) Schematic of the superovulation model and PFNA exposure in vivo. (B) Average numbers of ovulated oocytes collected from prepubertal mice treated with vehicle (n=18), 1 (n=9), 5 (n=13), and 25 (n=9) mg/kg of PFNA; asterisk indicates the significant difference from different PFNA dose groups to the control group (0mg/kg PFNA). (C) Representative images of ovary histology from mice treated with PBS and 25mg/kg PFNA. Red arrows indicate unovulated late-stage antral follicles. (D) Average number of antral follicles in mice treated with PBS (n=5) or 25mg/kg PFNA (n=5). (E) Analytical measurement of PFNA in the serum, whole ovary, or FF of large antral follicles (n=34). The amount of PFNA in the whole ovary and ovary FF is referred to the left y-axis (PFNA ng per ovary). The concentration of PFNA in serum is referred to the right y-axis (PFNA μg/mL serum). (F) Relative mRNA expression of ovulation-related genes at 4 h post hCG injection examined by RT-qPCR (n=5 in the control and n=5 in the PFNA treatment group). Expression data were normalized with Gapdh. Asterisk indicates the significant difference from different PFNA dose groups to the control 4 h post-hCG group (0μM). (G) Representative images of in situ hybridization of large antral follicles treated with vehicle or PFNA at 4 h post hCG injection. (H) Average numbers of ovulated oocytes collected from mice treated with PBS (n=8), 1mg/kg PPARγ antagonist (GW9662) (n=5), 25mg/kg PFNA (n=8), or cotreatment of PPARγ antagonist (GW9662) and PFNA (n=9); asterisk indicates the significant difference between two connected groups. Data were analyzed with Student’s t-test (B,D). Error bars: mean±SD. Data in Figure 10 are presented in Excel Table S19. Note: FF, follicular fluid; Gapdh, glyceraldehyde-3-phosphate dehydrogenase; hCG, human chorionic gonadotrophin; ND, nondetectable; PBS, phosphate-buffered saline; PFNA, perfluorononanoic acid; PPARγ, peroxisome proliferator–activated receptor gamma; RT-qPCR, reverse transcription–quantitative polymerase chain reaction; SD, standard deviation. *p<0.05; **p<0.01.
Figures 11A and 11B are bar graphs titled Follicle rupture and Meiotic resumption, plotting benchmark concentration lower-confidence limit begin subscript 10 end subscript (micromolar), ranging from 0 to 30 in increments of 10 and 0 to 40 in increments of 10 (y-axis) across Perfluorononanoic acid exposure window, including dual, maturation, and ovulation (x-axis), respectively.
Figure 11.
BMCL10 of PFNA for dual-, maturation-, and ovulation-window exposures as indicated for in vitro follicle rupture (A) and meiotic resumption (B). Data presented in this figure are also included in Excel Table S5–S7. Note: BMCL, benchmark concentration lower confidence limit; BMD, benchmark dose modeling; PFNA, perfluorononanoic acid.

References

    1. Buck RC, Franklin J, Berger U, Conder JM, Cousins IT, de Voogt P, et al. . 2011. Perfluoroalkyl and polyfluoroalkyl substances in the environment: terminology, classification, and origins. Integr Environ Assess Manag 7(4):513–541, PMID: 21793199, 10.1002/ieam.258. - DOI - PMC - PubMed
    1. Heydebreck F, Tang J, Xie Z, Ebinghaus R. 2015. Alternative and legacy perfluoroalkyl substances: differences between European and Chinese river/estuary systems. Environ Sci Technol 49(14):8386–8395, PMID: 26106903, 10.1021/acs.est.5b01648. - DOI - PubMed
    1. Gebbink WA, van Asseldonk L, van Leeuwen SPJ. 2017. Presence of emerging per- and polyfluoroalkyl substances (PFASs) in river and drinking water near a fluorochemical production plant in the Netherlands. Environ Sci Technol 51(19):11057–11065, PMID: 28853567, 10.1021/acs.est.7b02488. - DOI - PMC - PubMed
    1. Gangal SV. 2004. Perfluorinated polymers. In: Kirk-Othmer Encyclopedia of Chemical Technology. Hoboken, NJ: John Wiley & Sons, Inc., 1–68.
    1. Lindstrom AB, Strynar MJ, Libelo EL. 2011. Polyfluorinated compounds: past, present, and future. Environ Sci Technol 45(19):7954–7961, PMID: 21866930, 10.1021/es2011622. - DOI - PubMed

LinkOut - more resources