. 2025 Mar 4;26(2):bbaf146.
doi: 10.1093/bib/bbaf146.

CoPPIs algorithm: a tool to unravel protein cooperative strategies in pathophysiological conditions

Affiliations

CoPPIs algorithm: a tool to unravel protein cooperative strategies in pathophysiological conditions

Andrea Lomagno et al. Brief Bioinform. .

Abstract

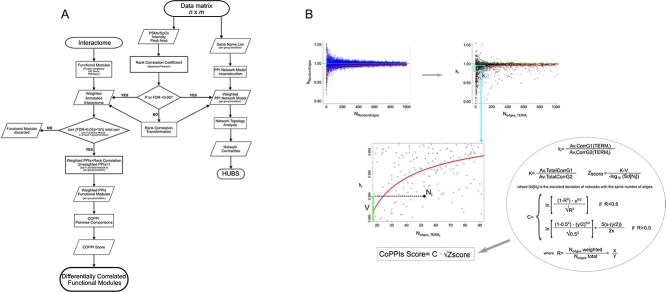
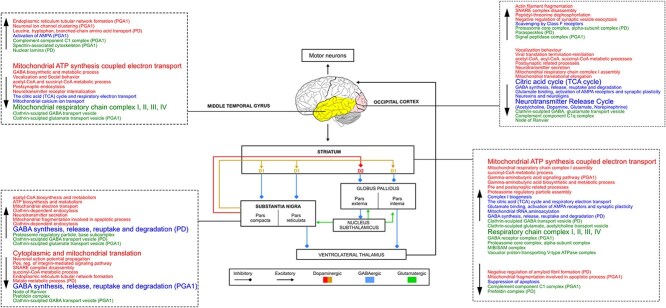
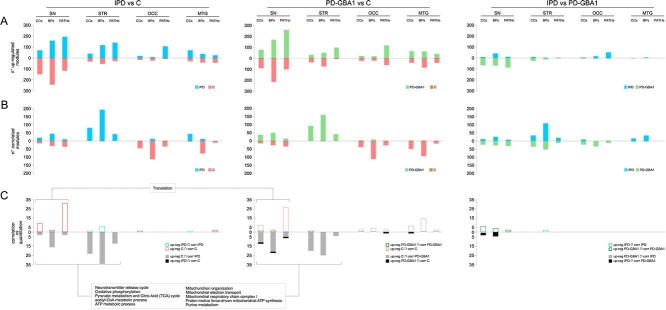
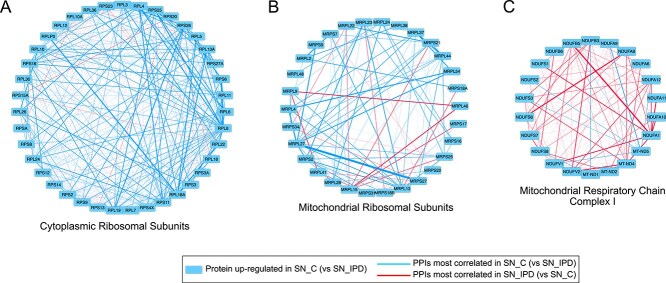
We present here the co-expressed protein-protein interactions algorithm. In addition to minimizing correlation-causality imbalance and contextualizing protein-protein interactions to the investigated systems, it combines protein-protein interactions and protein co-expression networks to identify differentially correlated functional modules. To test the algorithm, we processed a set of proteomic profiles from different brain regions of controls and subjects affected by idiopathic Parkinson's disease or carrying a GBA1 mutation. Its robustness was supported by the extraction of functional modules, related to translation and mitochondria, whose involvement in Parkinson's disease pathogenesis is well documented. Furthermore, the selection of hubs and bottlenecks from the weightedprotein-protein interactions networks provided molecular clues consistent with the Parkinson pathophysiology. Of note, like quantification, the algorithm revealed less variations when comparing disease groups than when comparing diseased and controls. However, correlation and quantification results showed low overlap, suggesting the complementarity of these measures. An observation that opens the way to a new investigation strategy that takes into account not only protein expression, but also the level of coordination among proteins that cooperate to perform a given function.

Keywords: PPI network; Parkinson; co-expression network; proteomics; topology.


Conflict of interest statement

All authors declare that they have no conflicts of interest.

Figures

Figure 1
Figure 1
Genesis and objectives of the combination of PPI and co-expression models. This strategy aims to assess whether proteins interacting physically and/or functionally, in order to cooperate to carry out functions and processes, are coordinated. In some ways we took inspiration from starlings (Sturnus vulgaris) when they defend themselves from aerial predators [22]. In particular, a single starling observes its neighbors and imitates them; usually it keeps a fixed number of neighbors under control, about 7–8. Therefore, we assume that proteins can have a similar behavior.
Figure 2
Figure 2
CoPPis algorithm. (A) Flowchart showing the main steps of CoPPIs algorithm. (B) Maths rationale of CoPPIs score. Top left, distribution of kRandomEdges ratios between the average values from a number of randomly selected correlations (NRandomEdges) in a pair of groups/conditions compared; the distribution of kRandomEdges ratios, which tends to K (green dashed line), is depicted as a function of the number of random correlations selected. Top-right, distribution of ratios between the average values of correlations ki corresponding to a specific biological term (Nedges_TERMi) in a pair of groups/conditions compared; the distribution of ki ratios, which tends to K (dashed line in the top boxes), is depicted as a function of the number of interactions of each term. In the box below, it is shown a detailed view of a generic term (Nedges_TERMi) with ratio V, while inside the circle the mathematical steps that lead to the formulation of the CoPPIs algorithm score.
Figure 3
Figure 3
PPIs vs. not PPIs correlation. (A) Barplot reporting the average absolute values of significant correlations associated with protein pairs physically/functionally interacting (PPIs) and not (non-PPIs). (B) Spearman’s correlation density distribution by comparing PPIs, where P1 and P2 are annotated with the same cellular component (CC), and PPIs where P1 and P2 are annotated with a different CC; blue and pink dotted lines indicate the average correlation. For both graphs, p value from Student’s t-test with NULL hypothesis that the mean of the distributions are the same.
Figure 4
Figure 4
Scheme summarizing the Nigrostriatal pathway and the functional modules differentially correlated in the corresponding brain regions (SN, STR, OCC, MTG). Dashed boxes show the main CC (green), biological processes (red), and Reactome pathways (blue), whose correlation significantly varies by comparing Control vs. IPD and PD-GBA1 subjects. In each box, up- and down-arrow indicates modules whose correlation is increased and decreased in IPD and PD-GBA1 (vs. Control), respectively.
Figure 5
Figure 5
Histograms showing the number of (A) differentially regulated and (B) differentially correlated functional modules by comparing the same brain region in the following pairwise comparisons: IPD vs. C, PD-GBA1 vs. C and IPD vs. PD-GBA1. In (C), it is reported that the number of functional modules with a similar (red, blue, green) and opposite (gray and black) trend of expression and correlation.
Figure 6
Figure 6
Functional modules showing the same and the opposite trend between quantitation and CoPPIs correlation. A) Cytoplasmic ribosomal subunits, B) Mitochondrial ribosomal subunits, and C) Mitochondrial respiratory chain Complex I in SNCvs SNIPD; the thickness of blue and red edges is proportional to the correlation value.
Figure 7
Figure 7
Venn diagram of hubs and bottlenecks found in brain regions from (A) controls and (B) IPD and PD-GBA1 subjects. Boxes show the best-five ranked hubs (in gray, by betweenness and centroid), bottlenecks (in black, by betweenness and bridging), and hubs/bottlenecks (in red, by betweenness, centroid and bridging) per brain region (sorted by betweenness).

Similar articles

References

    1. Joshi A, Rienks M, Theofilatos K. et al. . Systems biology in cardiovascular disease: a multiomics approach. Nat Rev Cardiol 2020;18:313–30. 10.1038/s41569-020-00477-1 - DOI - PubMed
    1. Suzuki Y, Kadomatsu K, Sakamoto K. Towards the in vivo identification of protein-protein interactions. J Biochem 2023;173:413–5. 10.1093/jb/mvad013 - DOI - PubMed
    1. Kewalramani N, Emili A, Crovella M. State-of-the-art computational methods to predict protein-protein interactions with high accuracy and coverage. Proteomics 2023;23:e2200292. 10.1002/pmic.202200292 - DOI - PubMed
    1. Vella D, Zoppis I, Mauri G. et al. . From protein-protein interactions to protein co-expression networks: a new perspective to evaluate large-scale proteomic data. EURASIP J Bioinform Syst Biol 2017;6. 10.1186/s13637-017-0059-z - DOI - PMC - PubMed
    1. Di Silvestre D, Brambilla F, Lavatelli F. et al. . The protein network in subcutaneous fat biopsies from patients with AL amyloidosis: more than diagnosis? Cells 2023;12:699. 10.3390/cells12050699 - DOI - PMC - PubMed

Substances