. 2025 Apr;29(7):e70500.
doi: 10.1111/jcmm.70500.

Tspo Depletion Exacerbates Steatosis Through Fatty Acid Uptake

Affiliations

Tspo Depletion Exacerbates Steatosis Through Fatty Acid Uptake

Yuchang Li et al. J Cell Mol Med. 2025 Apr.

Abstract

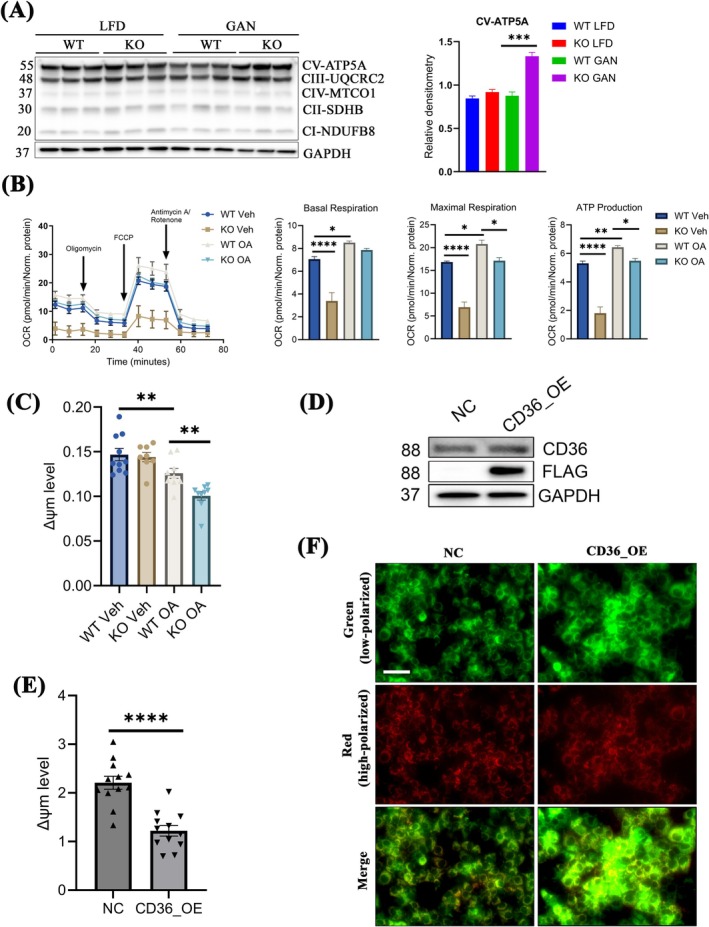
Previous studies demonstrated that Tspo loss causes simple steatosis (SS) in hepatocytes in vitro. However, its effect on SS in vivo remains unclear. In this study, we hypothesise that Tspo loss promotes early-stage MASLD. WT and Tspo KO rats were fed a Gubra Amylin NASH (GAN) diet for 8 weeks to induce SS. Tspo KO rats fed the GAN diet (KO GAN) exhibited increased insulin resistance, higher plasma cholesterol, and elevated hepatic triacylglycerol (TAG) levels, along with higher de novo lipogenesis (DNL) and free fatty acid (FFA) uptake, evidenced by increased fatty acid synthase (FASN) and CD36 expression. The Acyl-coenzyme A binding protein/diazepam-binding inhibitor-TSPO complex facilitated FA transport to the mitochondria, where carnitine palmitoyltransferase 1A (CPT1A) directed them for β-oxidation. TSPO interacted with CPT1A in the outer mitochondrial membrane, while its depletion increased CPT1A expression, boosting FA oxidation. Primary Tspo KO rat hepatocytes and stably overexpressed CD36 (CD36_OE) in Huh7 cells displayed impaired mitochondrial function and compromised mitochondrial membrane potential. KO GAN livers had significantly elevated AcCoA, which acetylated RAPTOR, activating mTORC1 to suppress autophagy. Overall, Tspo deficiency exacerbates the advancement of SS by enhancing CD36-mediated FFA uptake, elevating AcCoA levels, compromising mitochondrial function and impairing autophagy during the early stages of MASLD.

Keywords: MASLD; RAPTOR; acetyl‐coenzyme a; de novo lipogenesis; fatty acid oxidation.


Conflict of interest statement

The authors declare no conflicts of interest.

Figures

FIGURE 1
FIGURE 1
Lipids accumulation and insulin resistance in Tspo KO with GAN diet. (A) WT and Tspo KO rats were fed either a GAN diet or a low‐fat diet (LFD) over an 8‐week period. During the 7 weeks, GTT, ITT, and VLDL‐TAG were performed. The rats were divided into four groups: WT LFD, KO LFD, WT GAN, and KO GAN. The representative liver images were taken when collection. (B) Liver weight and body weight ratio (LW/BW), AST, ALT, plasma cholesterol. Plasma TAG, and hepatic TAG were measured (n = 10). (C) Immunoblot analysis of TNFα and ACTA2 with normalisation by GAPDH (n = 3). (D) Representative histological images of the livers by H&E staining, Oil Red O staining, and Sirius red staining (n = 3). Scale bar: 100 μm. GTT in (E) (n = 10) and ITT in (F) were performed (n = 10). ACTA2, actin alpha 2 (smooth muscle); ALT, alanine aminotransferase; AST, aspartate aminotransferase; GAN, Gubra‐Amylin NASH; GAPDH, glyceraldehyde 3‐phosphate dehydrogenase; GTT, glucose tolerance test; H&E, haematoxylin and eosin; ITT, insulin tolerance test; Oro, oil red o; TAG, triacylglycerol; TNFα, tumour necrosis factor alpha; VLDL‐TAG, very low‐density lipoprotein TAG. Data are presented as mean ± SEM. *p < 0.05, **p < 0.01 by one‐way ANOVA.
FIGURE 2
FIGURE 2
Higher DNL and fatty acid uptake in Tspo KO compared to WT with GAN diet (A) qPCR analysis of Srebp‐1c (n = 3). (B) Immunoblot analysis of FASN and quantification (n = 3). (C) qPCR of Cd36, Fatp5, Fatp1, and Mttp (n = 3). (D) Immunoblot analysis of CD36 (n = 3). (E) Immunohistochemistry staining of CD36 (n = 3), red arrow indicated positive signal. (F) Serum TAG measurement for VLDL‐TAG secretion (n = 10). DNL, de novo lipogenesis; FASN, fatty acid synthase; Cd36, cluster of differentiation 36; Fatp, fatty acid transport protein; GAN, Gubra‐Amylin NASH; Mttp, microsomal triglyceride transfer protein; Srebp‐1c, sterol regulatory element‐binding protein‐1c; VLDL‐TAG, very low‐density lipoprotein triacylglycerol. Scale bar: 20 μm. Data are presented as mean ± SEM, *p < 0.05, **p < 0.01, ***p < 0.001 by one‐way ANOVA.
FIGURE 3
FIGURE 3
Fatty acid transportation to mitochondria for FAO though fatty acyl‐CoA‐CPT1A. (A) PLA of TSPO and ACBP/DBI in liver tissues, white arrows indicated positive signal (red). NC is negative control no adding primary antibody. (B) Immunoblot analysis of ACBP/DBI and quantification (n = 3). (C) PLA of TSPO‐CPT1A in liver tissue; white arrows indicate red signal. NC is negative control no adding primary antibody. (D) Human Tspo‐Myc plasmid was transfected into H293 cells. The cell pellets were collected for immunoprecipitation by Myc‐Trap agarose beads. Immunoblot analysis with anti‐Myc and anti‐CPT1A antibodies was performed. Non‐TF: Non‐transfection. TF: Transfection. TF‐FL: Flow through from transfected cells. TF‐Elu: Elutes from transfected cells. (E) Immunoblot analysis in the liver of PPARα, CPT1A, and ACOX1 and quantification (n = 3). Scale bar: 20 μm in (A) and (C). FAO: Fatty acid oxidation; acyl‐CoA: Acyl‐Coenzyme A; CPT1A: Carnitine palmitoyltransferase 1A; PLA: Proximity ligation assay; ACBP/DBI: Acyl‐CoA binding protein/diazepam binding inhibitor; IP: Immunoprecipitation; PPARα: Peroxisome proliferator‐activated receptor alpha; ACOX1: Acyl‐CoA oxidase 1. The same immunoblot membrane was used for both Figures 2D and 3B, with GAPDH as the common loading control. Data are presented as mean ± SEM, *p < 0.05, **p < 0.01, ***p < 0.001 by one‐way ANOVA.
FIGURE 4
FIGURE 4
Malfunctional mitochondria in Tspo KO with GAN diet. (A) Immunoblot of OXPHOS comprising five complexes (complexes I–V [CI–CV]) in the liver tissue of rats and quantification (n = 3). (B) Seahorse assay in the cultured hepatocytes isolated from WT or KO rat livers and treated with BSA or 0.5 mM OA for 24 h. Quantification of oxygen consumption rate (OCR) for basal respiration, maximal respiration, and ATP production (n = 3). (C) Mitochondrial membrane potential (ΔΨm) test in cultured hepatocytes isolated from WT and KO rat livers treated with BSA or OA (n = 3). (D) Immunoblot analysis of CD36 and FLAG in Huh7 and transfected Huh7 with human CD36‐FLAG plasmid after 2 weeks of hygromycin (0.5 mg/mL) selection. NC: Huh7 negative control cells. CD36_OE: Stably overexpressed CD36 in Huh7. (E) Mitochondrial membrane potential (ΔΨm) test in NC (Huh7) and CD36_OE (n = 3). (F) Images for ΔΨm in NC (Huh7) and CD36_OE (n = 3). Green colour indicated low‐polarised signal; red colour indicated high‐polarised signal. ATP, adenosine triphosphate; BSA, bovine serum albumin; CD36‐FLAG, cluster of differentiation 36 with FLAG tag; OA, oleic acid; OXPHOS, oxidative phosphorylation. Scale bar: 100 μm. Data are presented as mean ± SEM, *p < 0.05, **p < 0.01, ***p < 0.001, ****p < 0.0001 by one‐way ANOVA.
FIGURE 5
FIGURE 5
RAPTOR acetylation in KO GAN. (A) Measurement of Acetyl‐CoA (AcCoA) in liver tissues from rat (n = 6). (B) IP with IgG or RAPTOR antibody and IB using an antibody against acetylated‐lysine (ACK); IB of RAPTOR and GAPDH is input control. IB, immunoblot; IgG, immunoglobulin G; IP, immunoprecipitation; RAPTOR, regulatory‐associated protein of mTOR. Data are presented as mean ± SEM, **p < 0.01 by one‐way ANOVA.
FIGURE 6
FIGURE 6
Autophagy impairment in Tspo KO with GAN diet. (A) Immunoblot analysis of p‐mTOR, mTOR, LC3, P62, p‐RPS6, and RPS6 in the liver tissues and quantification (n = 3). (B) Immunoblot analysis of LC3, p‐RPS6, RPS6 in cultured rat hepatocytes isolated from WT and KO treated with Vehicle (Veh) or OA (n = 3). (C) Representative confocal images in transiently transfected WT and KO rat primary hepatocytes with mRFP‐GFP‐LC3 plasmid followed by treatment with Veh or OA. Cells were fixed and imaged with 515/530‐nm band‐pass filter (green), or a 580‐nm long‐pass filter (red). Nuclei were stained with DAPI (blue). The bar graph shows quantification of yellow puncta (mRFP‐GFP‐LC3 positive) and red puncta (mRFP‐LC3 positive) per cell (n = 20 cells). Statistically significant changes compared to control cells (WT + Veh) are indicated with * (autophagosomes) or # (autolysosomes) above bars and statistically significant changes between the treated cells are indicated with * or # above brackets. (D) Immunoblot analysis of LC3, p‐RPS6, and RPS6 in Huh7 and CD36_OE Huh7 cells treated with Veh or OA and quantification (n = 3). (E) Representative confocal images in transiently transfected Huh7 cells or CD36_OE Huh7 cells with mRFP‐GFP‐LC3 plasmid followed by treatment with Veh or OA. Cells were fixed and imaged with 515/530‐nm band‐pass filter (green), or a 580‐nm long‐pass filter (red). Nucleus was stained with DAPI (blue). The bar graph shows quantification of yellow puncta (mRFP‐GFP‐LC3 positive) and red puncta (mRFP‐LC3 positive) per cell (n = 20 cells). Statistically significant changes compared to control cells (Huh7 Veh) are indicated with * (autophagosomes) or # (autolysosomes) above bars and statistically significant changes between the treated cells are indicated with * or # above brackets (n = 10 images per group). (F) Immunoblot analysis of p‐ULK1 (Ser757) and ULK1 in the liver tissue (n = 3). Scale bar: 20 μm. mTOR: Mechanistic target of rapamycin; LC3: Microtubule‐associated protein 1A/1B‐light chain 3; P62: Sequestosome 1 (SQSTM1); RPS6: Ribosomal protein s6; OA: Oleic acid; mRFP‐GFP‐LC3: Microtubule‐associated protein 1A/1B light chain 3B (LC3) fused with mRFP and GFP. Data are presented as mean ± SEM, * (or #) p < 0.05, ** (or ##) p < 0.01, *** (or ###) p < 0.001, **** (or ####) p < 0.0001 by one‐way ANOVA analysis.
FIGURE 7
FIGURE 7
Tspo KO exacerbates hepatic steatosis. Left panel: GAN leads to simple steatosis in WT rats. Right panel: Tspo KO exacerbates hepatic steatosis by upregulating CD36, which promotes the uptake of free fatty acids (FFA) and enhances de novo lipogenesis (DNL). The elevated FFA levels are transported into mitochondria through binding to CPT1A, facilitating fatty acid oxidation (FAO) and generating Acetyl‐CoA (AcCoA). The upregulated AcCoA acetylates mTORC1, impairing autophagic degradation. Furthermore, the upregulation of CD36 leads to dysfunctional mitochondria characterised by compromised mitochondrial membrane potential. Consequently, these cascading mechanisms lead to severe hepatic steatosis in Tspo KO liver. ACBP, acyl‐CoA binding protein; CD36, cluster of differentiation 36; CPT1A, carnitine palmitoyltransferase 1a; GAN, Gubra‐Amylin NASH; mTORC1, mechanistic target of rapamycin complex 1.

References

    1. Lazarus J. V., Mark H. E., Anstee Q. M., et al., “Advancing the Global Public Health Agenda for NAFLD: A Consensus Statement,” Nature Reviews. Gastroenterology & Hepatology 19 (2022): 60–78. - PubMed
    1. Harrison S. A., Bedossa P., Guy C. D., et al., “A Phase 3, Randomized, Controlled Trial of Resmetirom in NASH With Liver Fibrosis,” New England Journal of Medicine 390 (2024): 497–509. - PubMed
    1. Rone M. B., Fan J., and Papadopoulos V., “Cholesterol Transport in Steroid Biosynthesis: Role of Protein‐Protein Interactions and Implications in Disease States,” Biochimica et Biophysica Acta 1791 (2009): 646–658. - PMC - PubMed
    1. Papadopoulos V., Aghazadeh Y., Fan J., Campioli E., Zirkin B., and Midzak A., “Translocator Protein‐Mediated Pharmacology of Cholesterol Transport and Steroidogenesis,” Molecular and Cellular Endocrinology 408 (2015): 90–98. - PMC - PubMed
    1. Li Y., Chen L., Li L., et al., “Cholesterol‐Binding Translocator Protein TSPO Regulates Steatosis and Bile Acid Synthesis in Nonalcoholic Fatty Liver Disease,” Iscience 24 (2021): 102457. - PMC - PubMed

MeSH terms