. 2025 Apr 7;16(1):3149.
doi: 10.1038/s41467-025-58274-8.

Enabling new insights from old scans by repurposing clinical MRI archives for multiple sclerosis research

Affiliations

Enabling new insights from old scans by repurposing clinical MRI archives for multiple sclerosis research

Philipp Goebl et al. Nat Commun. .

Abstract

Magnetic resonance imaging (MRI) biomarkers are vital for multiple sclerosis (MS) clinical research and trials but quantifying them requires multi-contrast protocols and limits the use of abundant single-contrast hospital archives. We developed MindGlide, a deep learning model to extract brain region and white matter lesion volumes from any single MRI contrast. We trained MindGlide on 4247 brain MRI scans from 2934 MS patients across 592 scanners, and externally validated it using 14,952 scans from 1,001 patients in two clinical trials (primary-progressive MS and secondary-progressive MS trials) and a routine-care MS dataset. The model outperformed two state-of-the-art models when tested against expert-labelled lesion volumes. In clinical trials, MindGlide detected treatment effects on T2-lesion accrual and cortical and deep grey matter volume loss. In routine-care data, T2-lesion volume increased with moderate-efficacy treatment but remained stable with high-efficacy treatment. MindGlide uniquely enables quantitative analysis of archival single-contrast MRIs, unlocking insights from untapped hospital datasets.


Conflict of interest statement

Competing interests: D.C. is a consultant for Hoffmann-La Roche. In the last three years he has been a consultant for Biogen, has received research funding from Hoffmann-La Roche, the International Progressive MS Alliance, the MS Society, the Medical Research Council, and the National Institute for Health Research (NIHR) University College London Hospitals (UCLH) Biomedical Research Centre, and a speaker’s honorarium from Novartis. He co-supervises a clinical fellowship at the National Hospital for Neurology and Neurosurgery, London, which is supported by Merck. F.B. acts as a member of the steering committee or Data Safety Monitoring Board for Biogen, Merck, ATRI/ACTC and Prothena. Consultant for Roche, Celltrion, Rewind Therapeutics, Merck, IXICO, Jansen, Combinostics. Research agreements with Merck, Biogen, GE Healthcare, Roche. Co-founder and shareholder of Queen Square Analytics LTD. O.C. is a NIHR Research Professor (RP-2017-08-ST2-004); over the last 2 years, member of independent DSMB for Novartis; she gave a teaching talk in a Merck local symposium, and contributed to an Advisory Board for Biogen; she is Deputy Editor of Neurology, for which she receives an honorarium; she has received research grant support from the MS Society of Great Britain and Northern Ireland, the NIHR UCLH Biomedical Research Centre, the Rosetree Trust, the National MS Society, and the NIHR-HTA. C.H. reports grant support from the MRC and MS Society. She has served as a consultant to Novartis, Roche, UCB and Sanofi. S.N. has received research funding from the Canadian Institutes of Health Research, the International Progressive MS Alliance, the Myelin Repair Foundation, Immunotec, and F. Hoffman LaRoche, not related to the current work; he is a consultant for Sana Biotech, has received a speaker’s honorarium from Novartis Canada, and is a part-time employee of NeuroRx Research. In the last 3 years, J.C. has received support from the Health Technology Assessment (HTA) Programme (National Institute for Health Research, NIHR), the UK MS Society, the US National MS Society and the Rosetrees Trust. He is supported in part by the NIHR University College London Hospitals (UCLH) Biomedical Research Centre, London, UK. He has been a local principal investigator for a trial in MS funded by MS Canada. A local principal investigator for commercial trials funded by: Ionis and Roche; and has taken part in advisory boards/consultancy for Biogen, Contineum Therapeutics, InnoCare, Lucid, Merck, NervGen, Novartis and Roche. G.J.M.P. is a shareholder and director of, and receives salary from, Bioxydyn Limited. He is a shareholder and director of Queen Square Analytics Limited. He is a shareholder and director of Quantitative Imaging Limited. D.C.A. is a shareholder and director of Queen Square Analytics Limited. In the past three years, A.E. has received research grants from the Medical Research Council (MRC), NHS England, Imperial College Healthcare Trust, National Institute for Health and Social Care Research (NIHR), Innovate UK, Biogen, Merck, and Roche. He has served as an advisory board member of Merck Serono and Bristol Myers Squib. He is the founder and equity stakeholder in Queen Square Analytics Limited. He serves on the editorial board of Neurology (American Academy of Neurology). The remaining authors declare no competing interests.

Figures

Fig. 1
Fig. 1. Developing and testing the MindGlide model.
MindGlide model enables highly efficient and robust MRI segmentation. Segmenting and quantifying lesions on heterogeneous contrasts with minimal pre-processing (and no pre-processing required by the user). MindGlide model generalizes to tasks not used to train the model, such as segmenting T2-weighted and positron density MRI scans in unseen data sets. a Provides an overview of real (top) and augmented (bottom) training data. b, c Illustrate all parts of our training and fine-tuning pipeline. d Shows images of heterogenous contrasts used for testing MindGlide. FLAIR Fluid Attenuated Inversion Recovery, MRI magnetic resonance imaging.
Fig. 2
Fig. 2. Performance comparisons with state-of-the-art and ground truth.
A Boxplot displaying Lesion Load estimates (mm3) and distributions measured using ground truth manual delineations (grey), MindGlide (blue) and Freesurfer’s SAMSEG (orange). Lesion load estimates between Ground truth and SAMSEG and MindGlide and SAMSEG methods were significantly different (paired t-tests). B Boxplot displaying Dice scores, Sensitivity and Precision measurements for both MindGlide (blue) and SAMSEG (orange) delineated lesions. ***P < 0.001, **P < 0.01, *P < 0.05. For (A) and (B) we used two openly available lesion segmentation datasets comprising 50 brain MRI images and segmentation masks as ground truth comparators (N = 50, see Supplementary methods),. In (C) we calculated Spearman’s correlation coefficients for regional brain volumes obtained from MindGlide and Fressurfer’s SAMSEG and WMH-Synthseg against the expanded disability status scale (EDSS). The analysis evaluates correlations of lesion, deep grey matter (DGM), and cortical grey matter (CGM) volumes with EDSS, across FLAIR and T2 MRI contrasts. As a ground truth comparator for the correlation between lesion volume and EDSS we used manually labelled lesions by expert neuroradiologists. For all tested regions and contrasts MindGlide’s output shows on average higher correlations with EDSS scores except for CGM in T2 (although as shown, they are not statistically significantly different across software). Error bars represent 95% CI. Data are presented as boxplots where the black line on the centre of the boxplot represents the median, the box encloses the lower and upper quartiles, and the whiskers extend to the minimum and maximum values within a range of 1.5 times the interquartile range. Values outside 1.5 times the interquartile range are displayed as black dots. For (C) we used the baseline images of our PPMS dataset (N = 699) and data are represented as Spearman’s correlation coefficients and error bars indicate 95% confidence intervals. GT ground truth (manually labelled lesion segmentation by expert neuroradiologists). Source data are provided as a Source Data file.
Fig. 3
Fig. 3. Measuring treatment effects using single MRI contrasts.
MindGlide uniquely enables quantifying treatment effects using single MRI contrasts, including those that have never been used for this purpose (e.g., T2-weighted MRI). AC shows longitudinal volume changes with results for our PPMS dataset on the top and results for our SPMS dataset on the bottom. A Illustrates the annual per cent change in lesion volume detected by MindGlide across FLAIR, PD, T1, and T2 contrasts (resolution: 1 × 1 × 3 mm) for primary progressive MS (PPMS) and secondary progressive MS (SPMS) cohorts, stratified by treatment allocation. Notably, treatment cohorts exhibited a reduction in lesion volume accrual compared to placebo across all contrasts. B Depicts the annualized rate of cortical grey matter (CGM) atrophy. MindGlide successfully differentiated between treatment and placebo groups, demonstrating reduced cortical atrophy across all MRI contrasts in treated patients. This is also the case for atrophy rates in deep grey matter (DGM) as seen in (C). There are no FLAIR and PD contrasts available for the SPMS cohort. D Shows inter-contrast consistency for percentage brain volume changes (PBVC): High intra-class correlation coefficients (ICC) for percent brain volume change (PBVC) across different MRI contrasts within the PPMS dataset (2D), indicating high inter-contrast consistency. This underscores the segmentation tool’s robustness and consistency in detecting neurodegenerative changes across various imaging contrasts. In the SPMS dataset we compared PBVC of 2D-T1 images and 2D-T2 images with an ICC-coefficient of 0.81 [95% CI 0.73–0.87]. PPMS: N = 680, SPMS: N = 130. All boxes in (AD) display medians and 95% CI. Source data are provided as a Source Data file.
Fig. 4
Fig. 4. Longitudinal changes of brain regions and lesion volumes in the routine-care paediatric dataset.
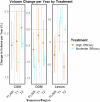
Linear mixed-effects models for cortical grey matter, deep grey matter, and lesion volume on a paediatric real-world cohort, stratified by treatment allocation. Brain region volume changes over time in this real-world cohort. Median values are shown as a dot, and the whiskers show the 95% confidence intervals. N = 161 patients. 72 patients received high-efficacy treatment, and 89 received moderate efficacy treatment. FLAIR Fluid Attenuated Inversion Recovery, CGM Cortical Grey Matter, DGM Deep Grey Matter. Source data are provided as a Source Data file.
Fig. 5
Fig. 5. Example segmentations from various contrasts.
The figure shows separate segmentations by the MindGlide model on 2D T1-weighted, T2-weighted, FLAIR and PD contrasts in the PPMS trial. The top row shows the unprocessed (“raw”) scans, and the bottom row shows labels or segmentations corresponding to anatomical regions, in addition to white matter hyperintensities (or hypo-intensities in the case of T1-weighted contrast).
Fig. 6
Fig. 6. Comparison of longitudinal changes of brain regions and lesion volumes of MindGlide, longitudinal SAMSEG and WMH-Synthseg.
This figure compares derived percentage volume changes per year of MindGlide, longitudinal SAMSEG and WMH-Synthseg for lesion volume, CGM and DGM separated by treatment groups. We used the PPMS clinical trial for this comparison because it was the largest of our datasets and the only one that includes manually segmented lesion volumes by expert neuroradiologists which we used as ground truth. The effect size calculated using MindGlide-derived lesion volume changes is closest to the ground truth. WMH-Synthseg-derived lesion volume change in the placebo group is closest to the ground truth for both FLAIR and T2 images. Ground truth lesion accrual rate was −1.304% per annum in the treatment group and 3.33% per annum in the placebo group. For FLAIR images, MindGlide detected a lesion accrual rate of 0.64% per annum in the treatment group and 5.95% in the placebo group, compared to 1.863% and 12.566% for longitudinal SAMSEG and 0.56% and 3.11% for WMH-Synthseg. With T2 images, MindGlide showed lesion accrual rates of 2.151% and 6.775% for treatment and placebo groups, while longitudinal SAMSEG showed 4.47% and 13.277% and WMH-Synthseg showed 0.359% and 2.813% respectively. The differences between the three tools in measuring CGM and DGM changes are minor compared to lesion volume changes except for the CGM estimates of longitudinal SAMSEG. Here, especially in T2 images, longitudinal SAMSEG estimates more atrophy in the treatment group (−0.418% p.a.) than in the placebo group (−0.334% p.a.), although these differences are not significant (p = 0.291) PPMS dataset. N = 680. All boxes display medians (centre line in each box) and 95% CI (upper and lower bound of each box). A mixed-effects model was used to calculate treatment effects (see Methods, Statistical Analysis). FLAIR Fluid Attenuated Inversion Recovery, CGM Cortical Grey Matter, DGM Deep Grey Matter, GT Ground Truth. Source data are provided as a Source Data file.
Fig. 7
Fig. 7. Examples of MindGlide segmentations and WMH-Synthseg segmentation.
Examples of segmentation masks acquired using MindGlide and WMH-Synthseg. a Segmentation masks of a scan from our PPMS trial dataset with the segmentation mask acquired using MindGlide on top and the segmentation mask acquired using WMH-Synthseg on the bottom. Areas labelled as lesion are more conservative defined in the MindGlide segmentation mask (olive colour) than in the WMH-Synthseg segmentation mask (black). The red arrow points at an area that is incorrectly defined as lesion by WMH-Synthseg segmentation but not by MindGlide. b Segmentation masks of a scan from our routine clinical dataset (RRMS) with the segmentation mask acquired using MindGlide on top and the segmentation mask acquired using WMH-Synthseg on the bottom. WMH-Synthseg fails to segment an image acquired in anterior-posterior direction with 6 mm thick slices (as seen in the frontal area of the transverse view and multiple areas of the coronal view in (b)). Most segmentation tools are designed to use superior-inferior acquisition directions (as in (a)), while MindGlide allows segmentation of images acquired in any direction.
Fig. 8
Fig. 8. Consistency of regional segmentations across MRI contrasts.
Consistency of segmented regions or labels across multiple MRI contrasts measured by the intraclass Correlation Coefficients (ICCs). On the left, coloured brain maps depict all 19 brain region labels: CSF (Cerebrospinal Fluid), 3rd and 4th Ventricle, DGM (Deep Grey Matter), Pons, Brainstem, Cerebellar GM (Grey Matter), Temporal Lobe, Lateral Ventricle Frontal Horn, Lateral Ventricle, Ventral DC (Diencephalon), Optic Chiasm, Cerebellar Vermis, Corpus Callosum, Cerebral WM (White Matter), Frontal Lobe GM, Limbic Cortex GM, Parietal Lobe GM, and Occipital Lobe GM, along with MS (Multiple Sclerosis) Lesions. The right side presents ICC values ranging from 0 to 1 for these regions, providing a quantitative measure of the consistency across multiple MRI contrasts. Higher ICC values indicate greater consistency in the measurement of a particular brain region. Dots represent median intraclass Correlation Coefficient and error bars display 95% confidence intervals. A vertical dashed line marks the median intraclass Correlation Coefficient across all regions. PPMS dataset, baseline images, N = 699. Source data are provided as a Source Data file.

References

    1. Billot, B. et al. Robust machine learning segmentation for large-scale analysis of heterogeneous clinical brain MRI datasets. Proc. Natl. Acad. Sci.120, e2216399120 (2023). - PMC - PubMed
    1. Iglesias, J. E. et al. SynthSR: A public AI tool to turn heterogeneous clinical brain scans into high-resolution T1-weighted images for 3D morphometry. Sci. Adv.9, eadd3607 (2023). - PMC - PubMed
    1. Billot, B. et al. SynthSeg: Segmentation of brain MRI scans of any contrast and resolution without retraining. Med. Image Anal.86, 102789 (2023). - PMC - PubMed
    1. Cerri, S. et al. A contrast-adaptive method for simultaneous whole-brain and lesion segmentation in multiple sclerosis. NeuroImage225, 117471 (2021). - PMC - PubMed
    1. Cardoso, M. J. et al. MONAI: An open-source framework for deep learning in healthcare. 10.48550/ARXIV.2211.02701 (2022)

LinkOut - more resources