. 2025 Apr;7(4):778-791.
doi: 10.1038/s42255-025-01249-2. Epub 2025 Apr 7.

Pre-fertilization-origin preservation of brown fat-mediated energy expenditure in humans

Affiliations

Pre-fertilization-origin preservation of brown fat-mediated energy expenditure in humans

Takeshi Yoneshiro et al. Nat Metab. 2025 Apr.

Abstract

Environmental thermal stress substantially affects cellular plasticity of thermogenic adipocytes and energy balance through transcriptional and epigenetic mechanisms in rodents. However, roles of cold-adaptive epigenetic regulation of brown adipose tissue (BAT) in systemic energy metabolism in humans remained poorly understood. Here we report that individuals whose mothers conceived during cold seasons exhibit higher BAT activity, adaptive thermogenesis, increased daily total energy expenditure and lower body mass index and visceral fat accumulation. Structural equation modelling indicated that conception during the cold season protects against age-associated increase in body mass index through BAT activation in offspring. Meteorological analysis revealed that lower outdoor temperatures and greater fluctuations in daily temperatures during the fertilization period are key determinants of BAT activity. These findings suggest that BAT metabolic fate and susceptibility of metabolic diseases are preprogrammed by the epigenetic inheritance of cold exposure before the fertilization in humans.


Conflict of interest statement

Competing interests: The authors declare no competing interests.

Figures
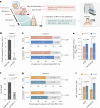
Fig. 1
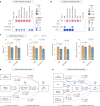
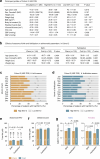
Fig. 1. Season of fertilization predetermines the metabolic fate of brown adipose tissue in human adults.
a, Study protocol for investigating intergenerational control of BAT in humans. BAT activity and density were assessed by 18F-FDG-PET/CT following acute cold exposure and NIR-TRS, respectively. The day of fertilization was estimated based on the day of birth. Seasons of birth and fertilization were determined according to the participant’s days of birth and fertilization as depicted in Extended Data Fig. 1b. b, Cold-induced BAT activity assessed as FDG uptake value (standardized uptake value; SUV) of the high and low BAT groups in Cohort 1. High BAT group (n = 259), low BAT group (n = 97). c, Association of the prevalence of cold-activated BAT and the season of birth in b. Warm birth group (n = 188), cold birth group (n = 168). d, Association of prevalence of cold-activated BAT and the season of fertilization in b. Warm fertilization group (n = 159), cold fertilization group (n = 197). e, Cold-induced BAT activity assessed as FDG uptake value (SUV) in c and d. f, BAT density (BAT-d) of the high and low BAT-d groups assessed as total haemoglobin concentration, [total Hb], in the supraclavicular region in Cohort 2. High BAT-d group (n = 143), low BAT-d group (n = 143). g, Association of the percentage of participants with high BAT-d and season of birth in f. Warm group (n = 144), cold birth group (n = 142). h, Association of the percentage of participants with high BAT-d and season of fertilization in f. Warm fertilization group (n = 153), cold fertilization group (n = 133). i, BAT-d assessed as [total Hb] in the supraclavicular region in g,h. Biologically independent samples (bi). Number of participants (n) is indicated on the graph. Data are mean ± s.e.m.; two-tailed P values by unpaired Student’s t-test (b,e,f,i). Data are percentage; one-tailed P values by Fisher’s exact test (c,d,g,h). Source data
Fig. 2
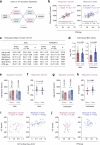
Fig. 2. Pre-fertilization-origin activation of BAT preserves higher adaptive thermogenesis in offspring adults.
a, Whole-body resting EE and CIT of the warm (n = 23) and cold birth groups (n = 19) (Cohort 3) measured in winter. Left, resting EE adjusted for FFM at thermoneutral condition (27 °C) and after 2-h cold exposure (19 °C). Right, CIT. b, Whole-body resting EE and CIT of the warm (n = 14) and cold fertilization groups (n = 28) (Cohort 3) measured in winter. Resting EE adjusted for FFM at thermoneutral condition (27 °C) and after 2-h cold exposure (19 °C) (left). CIT (right). c, Postprandial changes in resting EE adjusted for FFM (left) and DIT calculated as incremental area under the curve (iAUC, right) for the warm (n = 10) and cold birth groups (n = 13) (Cohort 4). d, Postprandial changes in resting EE adjusted for FFM (left) and DIT calculated as iAUC (right) for the warm (n = 6) and cold fertilization groups (n = 17) (Cohort 4). Biologically independent samples (ad). Data are mean ± s.e.m.; two-tailed P values by unpaired Student’s t-test or by two-way repeated measures ANOVA (a,b and c,d, right) with post hoc unpaired Student’s t-test (c,d left). Source data
Fig. 3
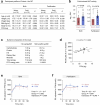
Fig. 3. Fertilization in the cold season increases TEE of offspring in free-living conditions.
a, Association of daily TEE measured by the DLW method with FFM, fat mass, step counts and physical activity level in Cohort 5 (n = 41). b, TEE adjusted for FFM and steps per day using an equation according to the multivariate regression analysis (model 1; Extended Data Fig. 6c) for predicting body size and physical activity-independent TEE of each participant. Warm birth group (n = 22) and cold birth group (n = 19) (left). Warm fertilization group (n = 20) and cold fertilization group (n = 21) (right). c, Univariate and multivariate regression analysis for estimating independent effects of birth and fertilization seasons on TEE. The warm and cold birth seasons were coded as 1 and 2, respectively. The warm and cold fertilization seasons were coded as 1 and 2, respectively. Model 2, R2 = 0.804, P < 0.001. Biologically independent samples (ac). Pearson’s correlation coefficient (r) and two-tailed P values (a). Data are mean ± s.e.m.; two-tailed P values by unpaired Student’s t-test (b). Data are correlation coefficient by univariate Pearson’s (for age, height, weight, FFM, fat mass, steps and physical activity) or Kendall’s rank correlation analysis (for sex and seasons) (c, left). Error bars indicate 95% CIs. Data are unstandardized β (middle) and standardized β (right) by multivariate regression model with backward stepwise method (model 2); two-tailed P values (middle and right). Error bars indicate 95% CIs. Source data
Fig. 4
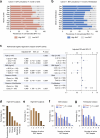
Fig. 4. Fertilization in the cold season prevents obesity through the activation of BAT in the offspring.
a, Associations of the season of fertilization and BAT activity with adiposity-related parameters in healthy young males (Cohort 1). b, Associations of the season of fertilization and BAT-d with adiposity-related parameters in the healthy participants with a wide range of ages (Cohort 2). SBP, systolic blood pressure; DBP, diastolic blood pressure. c, Impact of the seasons of birth and fertilization on adiposity-related parameters including BMI, body fat content, visceral fat area and waist circumference in b. d, Structural equation modelling for predicting the factors associated with BMI in a. e, Structural equation modelling for predicting the factors associated with BMI in b. Biologically independent samples (ae). Pearson’s (for age, BAT activity and BAT-d) or Kendall’s rank correlation analysis (for seasons) and two-tailed P value by correlation analysis (a,b). Data are mean ± s.e.m.; two-tailed P value by unpaired Student’s t-test. Numbers of participants (n) are indicated on the graph (c). Structural equation modelling: standardized β and two-tailed P values (d,e). NS, not significant. Source data
Fig. 5
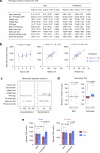
Fig. 5. Outdoor temperature and its diurnal variation as key meteorological factors influencing intergenerational BAT activity and adiposity.
a, Schematic of the study design for the meteorological survey and the definition of pregnancy periods. The pregnancy period was divided into five periods: preconception (−12 to −9 months), the first trimester (−9 to −6 months), second trimester (−6 to −3 months), third trimester (−3 to 0 months) and postpartum (0 to 3 months). b, Schematic showing the extraction of meteorological data for pregnancy periods from Japan created by the JMA, the NARO and the NAOJ. Data were obtained for birth and fertilization regions. c, Multivariate logistic regression using the backward stepwise method to predict BAT activity in young male volunteers (n = 93, model 1). Model 1 was adjusted for age, BMI, medical history and lifestyle factors (smoking and shift work). Variables included BAT activity (binary: 1 or 0), age and BMI: (the tertile values: 1, 2 or 3), low birth weight (yes, 1 and no, 0), smoking status (never, former, current: 1, 2, 3) and shift work (never, former, current: 1, 2, 3). d, Independent effects of diurnal temperature variation on BAT activity in c (model 2). Diurnal variation, calculated as the difference between dairy maximum and minimum temperatures, was added alongside daily mean temperature and other meteorological parameters. Model 2 adjustments were identical to model 1. e, Participants were categorized by seasonal birth and fertilization conditions: (1) warm birth/warm fertilization (n = 77), (2) warm birth/cold fertilization (n = 111), (3) cold birth/warm fertilization (n = 82) and (4) cold birth and cold fertilization (n = 86). f,g, Combined effects of the seasons of birth and fertilization on BAT prevalence (f) and activity (g). Numbers of participants with active BAT/total participants are indicated on the bars. Biologically independent samples (cg). Data are adjusted ORs with 95% CIs as error bars: two-tailed P values by multivariate logistic regression (c,d); percentage: one-tailed P values by Fisher’s exact test (f); mean ± s.e.m.; two-tailed P values by unpaired Student’s t-test (g). Source data
Fig. 6
Fig. 6. Summary illustration of the intergenerational control of BAT metabolic fate and energy homeostasis by preconception cold exposure.
Preconception exposure to low outdoor temperature and temperature gap affects offspring’s metabolic phenotype, promoting higher EE in humans. Our findings propose a conceptional theory, named PfOHaD. This concept suggests that environmental factors, such as temperature exposure before conception, can programme physiological traits in offspring, potentially influencing their health outcomes across generations.
Extended Data Fig. 1
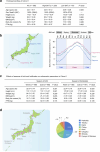
Extended Data Fig. 1. Effects of seasons of birth and fertilization on anthropometric parameters in young male volunteers.
(a) Participant profiles in the high (n = 259) and low (n = 97) BAT groups of Cohort 1. BAT activity was evaluated as SUV of FDG assessed by the FDG-PET/CT examination combined with acute cold exposure. Number of males/females in parentheses. (b) Climatological annual cycle of outdoor temperature in northern (Sapporo, latitude 43˚N), eastern (Tokyo, 36˚N), and western areas (Kagoshima, 31˚N) of Japan. Daily mean outdoor temperature for 11 years (2010–2020) was obtained from the JMA database and 11-day moving average was calculated for each calendar day. For the sake of simplicity, the year was divided into the cold season (January 1st – April 15th, and October 17th – December 31st) and warm season (April 16th – October 16th). (c) Participant profiles of the warm (n = 188) and cold (n = 168) birth groups and the warm (n = 159) and cold (n = 197) fertilization groups in Cohort 1. (d) A plot of the place of birth/fertilization of the participants of Cohort 1 who completed the birthplace survey (n = 237). The pie chart represents distribution of the participants to the eight major regions of Japan. (a, c, d) Biologically independent samples. Data are mean ± s.e.m.; two-tailed P values by unpaired Student’s t-test. Source data
Extended Data Fig. 2
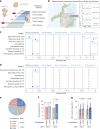
Extended Data Fig. 2. Season of fertilization is the independent determinant of the prevalence of cold-activated BAT in young male adults.
(a) Fluctuation of the prevalence of cold-activated BAT by month of birth. Numbers of participants with high and low BAT are indicated on the graph. (b) Fluctuation of the prevalence of cold-activated BAT by month of fertilization. Number of participants with high and low BAT are indicated on the graph. (c) Logistic regression analysis of BAT activity in Cohort 1. (d) Percentage of detection of cold-induced BAT in various regions in high BAT subjects (n = 259). (e) Percentage of the number of depots with active BAT in high BAT subjects (n = 259). (f) Effect of birth season on the number of active BAT depots in Cohort 1 (n = 356). (g) Effects of fertilization season on the number of active BAT depots in Cohort 1 (n = 356). (a-g) Biologically independent participants. (a, b, d-g) Data are percentage, and one-tailed P values by Fisher’s exact test (f, g). (c) Multivariate logistic regression analysis: adjusted odds ratios (ORs) with 95% confidence intervals (CIs) as error bars and two-tailed P values. * P < 0.05, ** P < 0.01. High BAT coded as 1 and low BAT coded as 0, as the dependent variable. Age: ≤ 22 years old, 23 years old, and ≥ 24 years old were coded as 1, 2, and 3, respectively. BMI: ≤ 20.3 kg/m2, 20.4 to 22.0 kg/m2, and > 22.0 kg/m2 were coded as 1, 2, and 3, respectively. The warm season and cold season of the birth and fertilization are coded as 0 and 1, respectively. Source data
Extended Data Fig. 3
Extended Data Fig. 3. Fertilization in cold season does not correlate with [total Hb] concentration in the abdominal WAT and deltoid skeletal muscle in male and female adults.
(a) Participant profiles of Cohort 2. BAT-d was evaluated using NIR-TRS. Participants were divided into two groups: high and low BAT-d groups. All participants: n = 286 except visceral fat area (n = 264), systolic (SBP, n = 282), and diastolic blood pressure (DBP, n = 282). High BAT-d: n = 143 except visceral fat area (n = 124), SBP (n = 140), and DBP (n = 140). Low BAT: n = 143 except visceral fat area (n = 140), SBP (n = 142), and DBP (n = 142). Number of males/females shown in parentheses. (b) Participant profiles of the warm (n = 144) and cold (n = 142) birth groups and the warm (n = 153) and cold (n = 133) fertilization groups in Cohort 2. (c) Fluctuation of the percentage of participants with high BAT-d by month of birth. Number of participants with high and low BAT-d are indicated on the graph. (d) Fluctuation of the percentage of participants with high BAT-d by month of fertilization. Number of participants with high and low BAT-d are indicated on the graph. (e) Total haemoglobin concentration, [total Hb], in the abdominal subcutaneous white adipose tissue: Comparisons between the warm (n = 136) and cold (n = 138) birth groups and between the warm (n = 147) and cold (n = 127) fertilization groups. (f) The [total Hb] in the deltoid skeletal muscle: Comparisons between the warm birth (n = 79) and cold birth (n = 77) groups and between the warm fertilization (n = 86) and cold fertilization (n = 70) groups. (g) A disaggregated analysis of BAT-d at the supraclavicular region for sex. Left: male, n = 108. Right: female, n = 178. (a-g) Biologically independent participants. Data are mean ± s.e.m.; two-tailed P values (a, b, e, f) or one-tailed P values (g) by unpaired Student’s t-test. Percentage of sex in (a, b); one-tailed P values by Fisher’s exact test. Source data
Extended Data Fig. 4
Extended Data Fig. 4. Fertilization in cold season increases adaptive cold-induced thermogenesis (CIT) in association with BAT activity.
(a) Schematic illustration of the crossover study design to measure CIT in summer (Jul., Aug., Sep.) and winter (Dec., Jan., Feb., Mar.) in Cohort 3 (n = 42). (b) Correlations between fat-free mass (FFM) and whole-body energy expenditure (EE) at thermoneutral 27°C and after cold exposure at 19°C for 2 hr in a. Left, EE measured in summer. Right, EE measured in winter. (c) Participant profile of the warm birth and cold birth groups and the warm fertilization and cold fertilization groups of Cohort 3. (d) BAT activity as the SUV of FDG for subjects in c. Left, the warm birth group (n = 23) and cold birth group (n = 19). Right, the warm fertilization group (n = 14) and cold fertilization group (n = 28). (e) Whole-body EE adjusted for FFM of the warm and cold birth groups at thermoneutral condition (27°C) and after 2-hr cold exposure (19°C) measured in summer. Warm birth group (n = 23); cold birth group (n = 19). (f) CIT of the warm and cold birth groups measured in summer in e. (g) Whole-body EE adjusted for FFM of the warm and cold fertilization groups at thermoneutral condition (27°C) and after 2-hr cold exposure (19°C) measured in summer. Warm fertilization group (n = 14); cold fertilization group (n = 28). (h) CIT of the warm and cold fertilization groups measured in summer in g. (i) Correlations of BAT activity with CIT measured in summer (left) and in winter (right). (j) Correlations of FFM with CIT measured in summer (left) and in winter (right). (b-j) Biologically independent samples. (c-h) Data are mean ± s.e.m.; two-tailed P values by unpaired Student’s t-test. (b, i, j) Pearson’s correlation coefficient (r) and two-tailed P values. Source data
Extended Data Fig. 5
Extended Data Fig. 5. Fertilization in cold season is associated with increased adaptive diet-induced thermogenesis (DIT).
(a) Participant profiles of the warm birth and cold birth groups and the warm fertilization and cold fertilization groups in Cohort 4 (n = 23). (b) BAT activity as SUV of FDG for subjects who participated in DIT measurement (Cohort 4). Left, the warm birth group (n = 10) and cold birth group (n = 13). Right, the warm fertilization group (n = 6) and cold fertilization group (n = 17). (c) Nutrient composition of the test meal. Participants ingested the nutritionally balanced food and liquid containing 500 kcal/63 kg body weight (BW). (d) Correlation between FFM and resting EE at thermoneutral 27°C. (e) Postprandial whole-body EE adjusted for FFM in the warm birth (n = 10) and cold birth (n = 13) groups. (f) Postprandial whole-body EE adjusted for FFM in the warm fertilization (n = 6) and cold fertilization (n = 17) groups. (a, b, d-f) Biologically independent samples. (a, b, e, f) Data are mean ± s.e.m.; two-tailed P values by unpaired Student’s t-test (a, b) or two-way repeated measures ANOVA (e, f). (d) Pearson’s correlation coefficient (r) and two-tailed P value. Source data
Extended Data Fig. 6
Extended Data Fig. 6. Fertilization in cold season increases total energy expenditure (TEE) in free-living condition, independently of FFM and physical activity.
(a) Participant profile, physical activity, and TEE of the warm birth (n = 22) and cold birth groups (n = 19) and the warm fertilization (n = 20) and cold fertilization groups (n = 21) in Cohort 5. (b) Correlations of daily TEE measured by the DLW method with age and anthropometric parameters. (c) Multivariate regression analysis for predicting daily TEE (n = 41, model 1, R2 = 0.794, P < 0.001). The TEE as dependent variable. Age, height, weight, FFM, fat mass, step count, physical activity level as independent variables. (d) Normalized daily TEE. Residual EE in multivariate regression model 1 in c was calculated for each subject as body size- and physical activity-independent TEE. Warm birth (n = 22); cold birth (n = 19); warm fertilization (n = 20); cold fertilization (n = 21). (e) A disaggregated analysis of TEE adjusted for FFM and step count for sex. Left: male, n = 19. Right: female, n = 22. (a-e) Biologically independent samples. (a, d, e) Data are mean ± s.e.m.; two- (a, d) or one-tailed (e) P values by unpaired Student’s t-test. Percentage of sex: one-tailed P values by Fisher’s exact test. (b) Pearson’s correlation coefficient (r) and two-tailed P values. (c) Unstandardized β with 95% CIs as error bars, standardized β, and two-tailed P values by multivariate regression analysis with backward stepwise method (model 1). Source data
Extended Data Fig. 7
Extended Data Fig. 7. Association of BAT with obesity-related parameters.
(a) Correlations between BAT activity by FDG-PET/CT and adiposity-related parameters including BMI, body fat content, body fat mass, FFM, abdominal total, subcutaneous, and visceral fat areas, and waist circumference in healthy male participants (Cohort 1). (b) Correlations between BAT-d by NIR-TRS and adiposity-related parameters including BMI, body fat content, skeletal muscle mass, visceral fat area, waist circumference, SBP, DBP, and heart rate in participants with wide range of age (Cohort 2). (a, b) Biologically independent samples. Pearson’s correlation coefficient (r) and two-tailed P value by correlation analysis. Numbers of participants (n) are indicated on the panels. Source data
Extended Data Fig. 8
Extended Data Fig. 8. Seasons of birth and fertilization does not influence on skeletal muscle mass and blood pressure.
(a) Impacts of the seasons of birth and fertilization on abdominal total, subcutaneous, and visceral fat areas and waist circumference in Cohort 1. (b) Impacts of the seasons of birth and fertilization on skeletal muscle mass in Cohort 2. (c) Impacts of the seasons of birth and fertilization on SBP, DBP and heart rate in Cohort 2. (a-c) Biologically independent samples. Data are mean ± s.e.m.; two-tailed P value by unpaired Student’s t-test. Numbers of participants (n) are indicated on the graph. Source data
Extended Data Fig. 9
Extended Data Fig. 9. Seasonal fluctuation of meteorological environmental parameters in Japan.
Climatological annual cycle of meteorological parameters in Tokyo, Japan. Daily maximum (max.) and minimum (min.) outdoor temperatures (temp.), precipitation, humidity, sunshine duration, atmospheric pressure, and diurnal range of outdoor temperature for 11 years (2010–2020) were obtained from the climate databases constructed by the JMA and NARO. Sunrise time and sunset time for 7 years (2012–2020) were obtained from the database constructed by the NAOJ to calculate daytime length. Diurnal temperature fluctuation was calculated as differences between maximum and minimum temperature and between maximum and mean temperature. For all meteorological parameters, 11-day moving average was calculated for each calendar day. Data are mean ± s.e.m., n = 11 except daytime length (n = 9). Source data
Extended Data Fig. 10
Extended Data Fig. 10. Effects of meteorological parameters at the pregnancy periods on BAT activity in adulthood.
(a) Multivariate logistic regression analysis for predicting independent effect of diurnal temperature gap, calculated as difference between maximum and mean outdoor temperature, on BAT activity (n = 93, model 3). The calculated diurnal temperature gap was added in the model in addition to daily mean temperature and the other meteorological parameters. Age, BMI, the medical history of low birth weight, and lifestyle factors such as smoking and shift work status were included in the model as potential confounding factors. (b) Association between BAT prevalence and diurnal temperature gap in a. The participants were divided into three groups according to the tertile of diurnal temperature gap in the five pregnancy periods. The number of participants of high and low BAT subjects were indicated on the graph. (a, b) Biologically independent participants. (a) Data are presented as adjusted ORs with 95% CIs as error bars and two-tailed P values by multivariate logistic regression analysis with backward stepwise method. High and low BAT coded as 1 and 0, respectively, as the dependent variable. The models were adjusted for the tertile values for age and BMI, the medical history of low birth weight, smoking status, shift work status. (b) Data are percentage with two-tailed P values by Chi-squared linear-by-linear association test. Source data

References

    1. Blüher, M. Metabolically healthy obesity. Endocr. Rev.41, bnaa004 (2020). - PMC - PubMed
    1. Whitlock, G. et al. Body-mass index and cause-specific mortality in 900 000 adults: collaborative analyses of 57 prospective studies. Lancet373, 1083–1096 (2009). - PMC - PubMed
    1. Cohen, P. & Kajimura, S. The cellular and functional complexity of thermogenic fat. Nat. Rev. Mol. Cell Biol.22, 393–409 (2021). - PMC - PubMed
    1. Sellers, A. J., Khovalyg, D., Plasqui, G. & van Marken Lichtenbelt, W. High daily energy expenditure of Tuvan nomadic pastoralists living in an extreme cold environment. Sci. Rep.12, 20127 (2022). - PMC - PubMed
    1. Saito, M. et al. High incidence of metabolically active brown adipose tissue in healthy adult humans: effects of cold exposure and adiposity. Diabetes58, 1526–1531 (2009). - PMC - PubMed

LinkOut - more resources