. 2025 Jun;31(6):1911-1924.
doi: 10.1038/s41591-025-03623-9. Epub 2025 Apr 7.

Mechanisms of hematopoietic clonal dominance in VEXAS syndrome

Affiliations

Mechanisms of hematopoietic clonal dominance in VEXAS syndrome

Raffaella Molteni et al. Nat Med. 2025 Jun.

Abstract

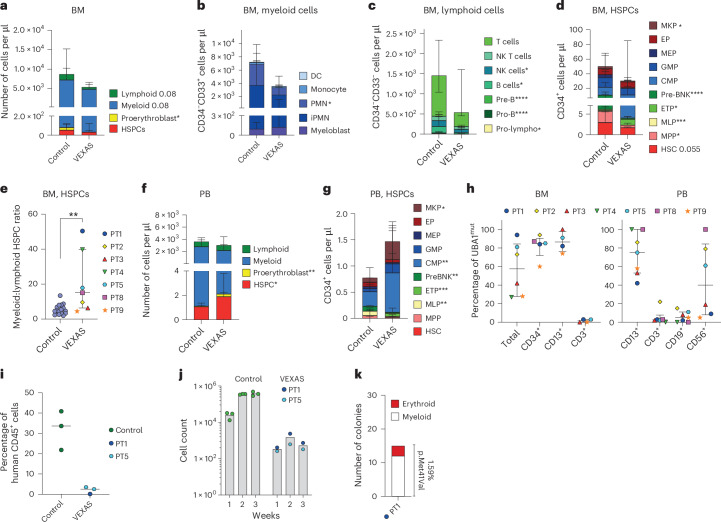
Clonal dominance characterizes hematopoiesis during aging and increases susceptibility to blood cancers and common nonmalignant disorders. VEXAS syndrome is a recently discovered, adult-onset, autoinflammatory disease burdened by a high mortality rate and caused by dominant hematopoietic clones bearing somatic mutations in the UBA1 gene. However, pathogenic mechanisms driving clonal dominance are unknown. Moreover, the lack of disease models hampers the development of disease-modifying therapies. In the present study, we performed immunophenotype characterization of hematopoiesis and single-cell transcriptomics in a cohort of nine male patients with VEXAS syndrome, revealing pervasive inflammation across all lineages. Hematopoietic stem and progenitor cells (HSPCs) in patients are skewed toward myelopoiesis and acquire senescence-like programs. Humanized models of VEXAS syndrome, generated by inserting the causative mutation in healthy HSPCs through base editing, recapitulated proteostatic defects, cytological alterations and senescence signatures of patients' cells, as well as hematological and inflammatory disease hallmarks. Competitive transplantations of human UBA1-mutant and wild-type HSPCs showed that, although mutant cells are more resilient to the inflammatory milieu, probably through the acquisition of the senescence-like state, wild-type ones are progressively exhausted and overwhelmed by VEXAS clones, overall impairing functional hematopoiesis and leading to bone marrow failure. Our study unveils the mechanism of clonal dominance and provides models for preclinical studies and preliminary insights that could inform therapeutic strategies.


Conflict of interest statement

Competing interests: S.F., L.N., M.F., D.C., A.W. and R.D.M. are inventors of patents on HSPC gene editing. R.M., M.F., G.C., L.N. and S.F. are inventors of patents on VEXAS syndrome. All patents are owned and managed by the San Raffaele Scientific Institute and the Telethon Foundation. L.N. is a founder, quota holder and consultant of GeneSpire and Chroma Medicine. G.C. is currently an employee of Novartis. The other authors declare no competing interests.

Figures

Fig. 1
Fig. 1. The HSPC compartment in patients with VEXAS syndrome is less enriched in phenotypically primitive cells and skewed toward myelopoiesis.
ad, Number of total hematopoietic cells (a), myeloid cells (b), lymphoid cells (c) and HSPCs (d) per microliter in BM aspirates of patients with VEXAS syndrome and age-matched controls assessed by multiparametric flow cytometry (n = 19 and 7). The median is shown with the interquartile range (IQR). Data on age-matched reference controls from ref. are shown. e, Ratio between the number of myeloid and lymphoid committed progenitors from patients (n = 19 and 7). The median is shown with the IQR. Data on age-matched reference controls from ref. are shown. f, Number of total hematopoietic circulating cells per microliter in the blood of patients with VEXAS syndrome and age-matched controls (n = 19 and 7). The median is shown with the IQR. Data on age-matched reference controls in eg from ref. are shown. g, Number of circulating HSPCs from different subpopulations per µl in the blood (n = 19 and 7). The median is shown with the IQR. h, Percentage of UBA1mut cells in the BM (left, n = 6, 5, 4 and 4) and peripheral blood (PB; right, n = 7, 6, 7 and 6) of different patients across hematopoietic subpopulations. Symbols and colors identify different patients. The median is shown with the IQR. i, Percentage of human cells in the BM of hematochimeric mice 12 weeks after transplantation of CD34+ HSPCs from healthy donors (n = 3) or patients with VEXAS syndrome (n = 3). Symbols and colors identify different donors of HSPCs. VEXAS HSPCs were transplanted without dilution with healthy donor HSPCs. j, Number of cells obtained on in vitro differentiation of HSPCs from patients with VEXAS syndrome (n = 2) and age-matched controls (n = 3). k, Number of erythroid and myeloid colonies obtained on seeding of 1,000 HSPCs from VEXAS PT1 (n = 1). The percentage represent the proportion of mutant colonies. For all panels, the Mann–Whitney U-test was used. *P < 0.5; **P < 0.01; ***P < 0.001; ****P < 0.0001. Source data
Fig. 2
Fig. 2. Insertion of VEXAS mutation by base editing in healthy HSPCs rewires their differentiation and clonogenic capacity in vitro.
a, Scheme of the base-editing strategy. b, Percentage of HSPCs carrying the intended Met41Thr VEXAS mutation 7 days after editing (n = 7 biological replicates). The median is shown with the IQR. c,d, Growth curve (c; n = 3 biological replicates; median with IQR) and cell-cycle phases (d; n = 2 biological replicates) of HSPCs after treatment. e, Percentage of live, early or late apoptotic and necrotic cells 24 h after treatment (n = 3 biological replicates). The values are the mean ± s.e.m. fh, Western blot analysis of UBA1a, UBA1b and UBA1c protein expression (f), poly(ubiquitylated) proteins (poly(Ub)) (g) and BiP expression level (h) in UBA1wt and UBA1mut HSPCs. β-Actin or β-tubulin was used as a protein-loading control (n = 2 technical replicates). i, Representative TEM images showing vacuoles in cultured UBA1wt and UBA1mut HSPCs 7 days after editing. High (left) and low (right) magnification images are shown. j, Representative optical microscopy images (×100 magnification objective) of UBA1wt and UBA1mut HSPCs 7 days after editing. Cells were stained with modified Giemsa. Red arrows indicate macrovacuoles in UBA1mut HSPCs (n = 1). k, Representative TEM images showing mitochondria in UBA1wt and UBA1mut HSPCs cultured for 7 days after editing. High (left) and low (right) magnification images are shown (n = 1). l, Quantitative analysis of circularity and occupied mitochondrial area in UBA1wt and UBA1mut HSPCs (n = 20 cells per condition from one donor). m, Significantly positively (pos) (red) and top-ten negatively (neg) (blue) enriched gene ontology biological processes in the bulk transcriptomic analyses of UBA1mut versus UBA1wt HSPCs cultured for 7 days after editing (n = 3 technical replicates of a pool of independent donors). Wilcoxon’s rank-sum test with the Benjamini–Hochberg correction was used. n, Volcano plot showing upregulated (red) and downregulated (blue) metabolites 7 days after differentiation of UBA1mut or UBA1wt HSPCs in culture (n = 3 biological replicates). The median is shown with the IQR. Student’s t-test with the Benjamini–Hochberg correction. o,p, Number of cells (o) and number of myeloid, erythroid, megakaryocytic, NK and pre-T cells (p) obtained on differentiation of UBA1mut or UBA1wt HSPCs in culture (n = 3 technical replicates). The median is shown with the IQR. q, Number of erythroid and myeloid colonies obtained on seeding HSPCs edited as indicated (n = 4, 4, 3 and 4). The median is shown with the IQR. Act., activation; aggreg., aggregation; imm., immunity; med, mediated; MK, mekakaryocytes; resp., response; UT, untreated. Panel a was created with BioRender.com. Source data
Fig. 3
Fig. 3. UBA1mut hematochimeric mice preserve myeloid and NK cell outputs but have poor lymphopoietic potential.
a, Schematic representation of the in vivo transplantation experiment. b, Percentage of human cells in PB, spleen and BM of hematochimeric mice transplanted with UBA1mut or UBA1wt HSPCs (n = 12 and 11). The median is shown with the IQR. ce, Percentage of human B cells (c), myeloid cells (d) and NK cells (e) within total cells in PB and hematopoietic organs of mice from b (n = 12 and 11). The median is shown with the IQR. f, Percentage of human HSPCs in the BM of mice from b (n = 12 and 11). The median is shown with the IQR. g, Percentage of cells within human CD34+ HSPCs expressing the CD19 or CD13 markers, or none of them, in mice from b (n = 12 and 11). Values given are mean ± s.e.m. h,i, Percentage of UBA1mut cells across hematopoietic populations in spleen (h) and BM (i) of mice from b (n = 12, 11). The median is shown with the IQR. j, Percentage of cells bearing insertions and deletions in the infused HSPC edited product (n = 1) and in the spleen and BM of hematochimeric mice 14 weeks after transplantation (n = 4 per group). The median is shown with the IQR. i, The Kruskal–Wallis test was used and, for all other panels, the Mann–Whitney U-test. *P < 0.05; **P < 0.01; ***P < 0.001; ****P < 0.0001. Ctrl, control. Panel a created with BioRender.com.
Fig. 4
Fig. 4. Primitive UBA1mut HSPCs are primed toward proinflammatory myeloid differentiation and prematurely aged.
a, Uniform manifold approximation and projection (UMAP) plot of human CD45+ cells, enriched in the CD34+ HSPC fraction, from the BM of mice transplanted with 100% UBA1wt or UBA1mut HSPCs. Clusters and associated cell types are indicated by name and color. b, B cell (top) and erythroid (bottom) pseudotime trajectories starting from the HSC or MPP cluster in the UMAP plot (left) and distribution of cells along the trajectory (right) from a. c, Heatmap showing normalized enrichment scores (NESs) for the GSEA performed within the differentiated clusters comparing 100% UBA1mut versus UBA1wt xenografts. Gray squares represent a mismatch between the DEGs of a selected cluster and the gene set as a result of the threshold for detecting the DEGs and the minimum gene set size for the calculation of the enrichment score. Wilcoxon’s rank-sum test with the Benjamini–Hochberg correction was used. d, Distribution of cells in G1, S or G2/M phases of the cell cycle within differentiated cell cluster and sample according to signatures from ref. . e, UMAP plot of human CD34+ HSPCs from the BM of mice transplanted with 100% UBA1wt or 40% UBA1mut HSPCs. f, Distribution of cells across HSPC clusters from scRNA-seq in e. g, Heatmap as in c showing NESs for the GSEA performed within HSPC clusters in e comparing 40% UBA1mut versus 100% UBA1wt xenografts. Wilcoxon’s rank-sum test with the Benjamini–Hochberg correction was used. h, Distribution of cells in G1, S or G2/M phases of the cell cycle within HSPC clusters in e. i, Density plots showing the distribution of cells from the 100% UBA1wt and 40% UBA1mut groups on the BM reference map from Extended Data Fig. 3e. j,k, AUCell scores based on a monocyte signature from ref. (j) and aged HSC signatures from refs. , (k) within primitive HSCs or MPPs according to projection on the BM reference map (n = 1,728 and 532 cells). The whiskers are located at 1.5× the IQR and the dots represent outliers. Wilcoxon’s rank-sum test with the Benjamini–Hochberg correction was used. **P < 0.01; ****P < 0.0001. Baso, basophils; conv, conventional; EMT, epithelial-to-mesenchymal transition; imm, immature; junc, junction; lympho, lymphoid; mast, mast cells; met, metabolism; myelo, myeloid cells; prec, precursors; prog, progression; prolif, proliferative; rej, rejection; sign, signalling; UPR, unfolded protein response.
Fig. 5
Fig. 5. Patients with VEXAS syndrome are hallmarked by pan-lineage activation of inflammatory programs, downregulation of cell-cycle-related genes and ineffective erythropoiesis.
a, UMAP plot of hematopoietic cells from the BM of patients with VEXAS syndrome from the San Raffaele (PT1, PT2, PT3, PT5, PT8 and PT9) and Wu et al. cohorts and age-matched controls. Clusters and associated cell types are indicated by name and color. b, Heatmap as in Fig. 4c showing the NESs for the GSEA performed within the CD34 clusters from a. Wilcoxon’s rank-sum test with the Benjamini–Hochberg correction was used. c, Volcano plots showing fold-changes of upregulated (red) and downregulated (green) genes comparing patients with VEXAS syndrome and controls within the ‘late erythroid cell’ cluster. Nonsignificant genes are shown in gray. Wilcoxon’s rank-sum test with the Benjamini–Hochberg correction was used. d, UMAP plot of human CD34+ cells from the BM of patients with VEXAS syndrome (San Raffaele and Wu et al. cohorts) and age-matched controls,. Clusters and associated cell types are indicated by name and color. ‘VEXAS-enr’ labels cluster with predominance of cells from patients with VEXAS syndrome. e,f, Heatmap as in Fig. 4c showing NESs for the GSEA performed within the CD34+ clusters from d in all patients (e) or in patients with the threonine mutation (f). Wilcoxon’s rank-sum test with the Benjamini–Hochberg correction was used. g,h, UCell scores based on the ‘VEXAS xenograft signature’ within CD34+ (g) and CD34 (h) clusters from patients with VEXAS syndrome and controls. The signature was built considering the top-50 upregulated genes in UBA1mut monocytes compared with the UBA1wt counterpart. Wilcoxon’s rank-sum test with the Holm–Bonferroni correction was used. *P < 0.05; **P < 0.01; ***P < 0.001; ****P < 0.0001. NS, nonsignificant; ery, erythroid; hemato, hematopoietic; hom, homeostasis.
Fig. 6
Fig. 6. Proinflammatory poisoning of healthy hematopoiesis drives clonal dominance in VEXAS syndrome.
a, Schematics of the in vivo competitive transplantation experiment mixing UBA1mut and UBA1wt HSPCs at different ratios. b,c, Number of human cells from the different hematopoietic compartments in the BM (b) and PB (c) of mice transplanted as shown in a (n = 5 per group). The median is shown with the IQR. d,e, Percentage of human hematopoietic cells within total live cells in the BM (d) and PB (e) of mice from b (n = 5 mice per group). The values are the mean ± s.e.m. f, Number of human and mouse cells in the BM of mice from b (n = 5 mice per group). The median is shown with the IQR. g, Ratio between the number of myeloid and lymphoid cells (n = 5 mice per group). The median is shown with the IQR. h,i, Number of lymphoid (h) and myeloid (i) cell subpopulations in mice from b (n = 5 mice per group). The median is shown with the IQR. j, Number of CD34+ HSPCs in mice from b (n = 5 mice per group). The median is shown with the IQR. k, Percentage of HSPC subpopulations in the BM of mice from b (n = 5 mice per group). The right panel zooms in the most primitive HSPC compartment. The values are the mean ± s.e.m. ln, Number of UBA1mut and UBA1wt HSPCs (l), myeloid cells (m) and B cells (n) (n = 5 mice per group). The median is shown with the IQR. o, Percentage of UBA1mut cells within each hematopoietic subpopulation in the mixed groups (n = 5 mice per group). Dotted squares indicate the percentage of infused UBA1mut HSPCs. The median is shown with the IQR. p, Concentrations of human cytokines in the BM of UBA1mut and UBA1wt mice 4 weeks after transplantation (n = 3, 4). q, UMAP plot of human CD45+ cells, enriched in the CD34+ HSPC fraction, from the BM of mice transplanted with 50% UBA1wt or UBA1mut HSPCs. Clusters and associated cell types are indicated by name and color. r, Heatmap as in Fig. 4c showing NESs for the GSEA performed within clusters in q comparing UBA1wt female cells from VEXAS mice versus UBA1wt female cells from wild-type mice. Wilcoxon’s rank-sum test with the Holm–Bonferroni correction was used and, for all other panels, the Kruskal–Wallis test. *P < 0.05; **P < 0.01; ***P < 0.001; ****P < 0.0001. Panel a created with BioRender.com.
Extended Data Fig. 1
Extended Data Fig. 1. Phenotypic distribution of hematopoietic cells in BM and PB of patients with VEXAS syndrome.
a-d, Percentage of cells within hematopoietic cells (a), myeloid cells (b), lymphoid cells (c) and HSPCs (d) from BM aspirates of patients with VEXAS syndrome and age-matched controls (n = 19, 7). Mean ± s.e.m. Data on age-matched reference controls from are shown. e-h, Percentage of cells within total circulating hematopoietic cells (e), myeloid cells (f), lymphoid cells (g) and HSPCs (h) in the blood of patients with VEXAS syndrome and age-matched controls (n = 19, 7). Mean ± s.e.m. i, Number of myeloid, erythroid, megakaryocytic, NK and preT cells obtained upon in vitro differentiation of HSPCs from two patients with VEXAS syndrome (n = 2) or age-matched controls (n = 3). For all panels: Mann-Whitney test.
Extended Data Fig. 2
Extended Data Fig. 2. Transcriptional and functional changes in UBA1mut cells in vitro.
a, Schematic representation of the editing procedure and in vitro experimental design in male human HSPCs. b-c, Western blot analysis of UBA1a, UBA1b, UBA1c protein expression (b), poly-ubiquitylated proteins (Poly-Ub) and BiP expression level (c) in UBA1wt and UBA1mut HSPCs. β-actin was used as protein loading control (n = 2 biological replicates from different HSPC donors). d, Volcano plots showing fold changes of up- (red) and down- (green) regulated genes comparing UBA1mut and UBA1wt HSPCs one (left) or seven (right) days after editing. Non-significant genes are shown in grey. Wilcoxon rank-sum test with Benjamini-Hochberg correction. e, Percentage of male primary T cells carrying the UBA1 edit over time after editing (n = 6 biological replicates). Median with IQR. Wilcoxon matched-pairs signed rank test. f, Percentage of live T cells at the endpoint of the experiment in ‘e’ (n = 6 biological replicates). Median with IQR. Wilcoxon matched-pairs signed rank test. g, Western blot analysis of cleaved caspase-3 in UBA1wt and UBA1mut T cells. β-actin was used as protein loading control. Panel a created with BioRender.com.
Extended Data Fig. 3
Extended Data Fig. 3. VEXAS-causing UBA1 mutation induces pan-lineage perturbation of hematopoietic cell states.
a, Number of human CD45+ cells homed to the BM 3 days after transplantation of UBA1wt or UBA1mut HSPCs (n = 3). Median. b, Percentage of cells within human CD45+ cells in spleen (left) and BM (right) of mice from Fig. 3j (n = 4/group). Mean ± s.e.m. c, Erythroid (left), B-cell (middle), and myeloid (right) pseudotime trajectories starting from the HSC/MPP cluster in UMAP plot (top) and distribution of cells along the trajectory (bottom) from Fig. 4e. d, Significant positively (red) and negatively (blue) enriched ‘Hallmark’ MSigDB signatures comparing GMP-2 versus GMP-1 clusters from Fig. 4e. Wilcoxon rank-sum test with Benjamini-Hochberg correction. e, Projection of CD34+ HSPCs from 100% UBA1wt and 40% UBA1mut scRNA-seq on a BM reference map. f, Cell abundance in the indicated clusters from ‘e’. g-i, AUcell scores of selected ‘Hallmark’ MSigDB database signatures (g,h) and aged HSC signatures from, (i) within primitive HSCs/MPPs according to projection on the BM reference map in ‘e’. Wilcoxon rank-sum test with Benjamini-Hochberg correction. j, Heatmap showing normalized enrichment scores (NES) for the GSEA performed using the indicated senescence signatures within the HSPC clusters from Fig. 4e. Wilcoxon rank-sum test with Benjamini-Hochberg correction.
Extended Data Fig. 4
Extended Data Fig. 4. Different strengths and natures of VEXAS perturbations of hematopoiesis depending on the type of UBA1 mutation in patients.
a, CD34 expression in cells from patients BM. b, Significant positively enriched ‘Hallmark’ MSigDB signatures comparing monocytes from patients with VEXAS syndrome and age-matched controls from the San Raffaele cohort by bulk RNA-seq. Wilcoxon rank-sum test with Benjamini-Hochberg correction. c, Volcano plot showing up- (red) and down- (blue) regulated metabolites in monocytes from patients with VEXAS syndrome and age-matched controls from the San Raffaele cohort. d, Distribution of cells in G1, S or G2/M phases of the cell cycle within differentiated cell clusters and samples in Fig. 5a according to signatures from ref. . e, Significant enriched ‘Hallmark’ MSigDB signatures across annotated clusters from the scRNA-seq dataset comparing patients with VEXAS syndrome from either of the two cohorts and age-matched controls. Wilcoxon rank-sum test with Benjamini-Hochberg correction. f, Heatmaps as in Fig. 4c showing NES for the GSEA performed within the differentiated clusters in patients with VEXAS syndrome compared to controls and segregating patients by mutations. Wilcoxon rank-sum test with Benjamini-Hochberg correction. g, Expression of NR4A1 and SOCS3 genes in patients with VEXAS syndrome and controls across HSPC clusters. Wilcoxon rank-sum test with Holm-Bonferroni correction. h, Heatmap showing NES for the GSEA performed using the indicated senescence signatures within the HSPC clusters comparing patients with VEXAS syndrome and controls. Wilcoxon rank-sum test with Benjamini-Hochberg correction.
Extended Data Fig. 5
Extended Data Fig. 5. Transcriptomic changes at the experimental endpoint in UBA1mut and UBAwt cells from VEXAS and WT mice.
a, Percentage of human cells in the BM of hematochimeric mice transplanted with UBA1mut or UBA1wt HSPCs and euthanized 4 weeks after transplant (n = 3, 4). Median. b-e, Heatmap as in Fig. 4c showing NES for the GSEA performed within clusters in Fig. 6q comparing: VEXAS and WT mice (b); UBA1mut male cells from VEXAS mice and UBA1wt male cells from WT mice (c); UBA1mut male cells and UBA1wt female cells from VEXAS mice (d); UBA1wt male cells and UBA1wt female cells from WT mice (e). f, Schematic representation of the serial transplantation experiment in the competitive setting. g, Percentage of human hematopoietic cells within total live cells in the BM of mice from secondary recipients in f (n = 2). Median. h, Percentage of UBA1mut cells across hematopoietic populations in the pooled BM from mice in g (n = 1). i, Schematic representation of the competitive transplantation experiment mixing UBA1wt HSPCs (labelled with a GFP reporter lentiviral vector) with either UBA1mut or UBA1wt HSPCs (labelled with a BFP reporter lentiviral vector). j, Number of colonies derived from sorted GFP+ HSPCs retrieved from VEXAS and WT mice. k, UMAP plot of murine Lin- HSPCs from the BM of mice transplanted with UBA1mut or UBA1wt HSPCs. Clusters and associated cell types are indicated by name and colors. l, Heatmap as in Fig. 4c showing NES for the GSEA performed within clusters from j. For all panels: Wilcoxon rank-sum test with Benjamini-Hochberg correction. Panels f,i created with BioRender.com.
Extended Data Fig. 6
Extended Data Fig. 6. Allogenic HSCT eradicates UBA1mut cells.
a, Schematic representation of the allo-HSCT experiment in the VEXAS model. b, Percentage of human cells in the BM of hematochimeric VEXAS mice treated or not with busulfan chemotherapy and donor-derived HSPC transplantation (n = 4/group). Median with IQR. c, Percentage of GFP+ (that is, donor-derived) cells within human cells in the BM of mice from b (n = 4/group). The red line indicates the percentage of GFP+ HSPCs in the donor input. Median with IQR. d, Percentage of UBA1mut cells within hematopoietic lineages in mice from b (n = 4/group). Median with IQR. Panel a created with BioRender.com.
Extended Data Fig. 7
Extended Data Fig. 7. Mechanisms of VEXAS pathophysiology and clonal dominance.
a-b, Graphical representations of the hallmarks of VEXAS pathogenesis (a) and of the mechanisms driving clonal dominance (b). Both panels created with BioRender.com.

References

    1. Martincorena, I. & Campbell, P. J. Somatic mutation in cancer and normal cells. Science349, 1483–1489 (2015). - PubMed
    1. Martincorena, I. et al. Tumor evolution. High burden and pervasive positive selection of somatic mutations in normal human skin. Science348, 880–886 (2015). - PMC - PubMed
    1. Lee-Six, H. et al. Population dynamics of normal human blood inferred from somatic mutations. Nature561, 473–478 (2018). - PMC - PubMed
    1. Olafsson, S. et al. Somatic evolution in non-neoplastic IBD-affected colon. Cell182, 672–684.e11 (2020). - PMC - PubMed
    1. Yizhak, K. et al. RNA sequence analysis reveals macroscopic somatic clonal expansion across normal tissues. Science364, eaaw0726 (2019). - PMC - PubMed

Substances

Supplementary concepts