

SARS-CoV-2 dynamics in New York City during March 2020-August 2023
- PMID: 40195487
- PMCID: PMC11977191
- DOI: 10.1038/s43856-025-00826-6
SARS-CoV-2 dynamics in New York City during March 2020-August 2023
Abstract
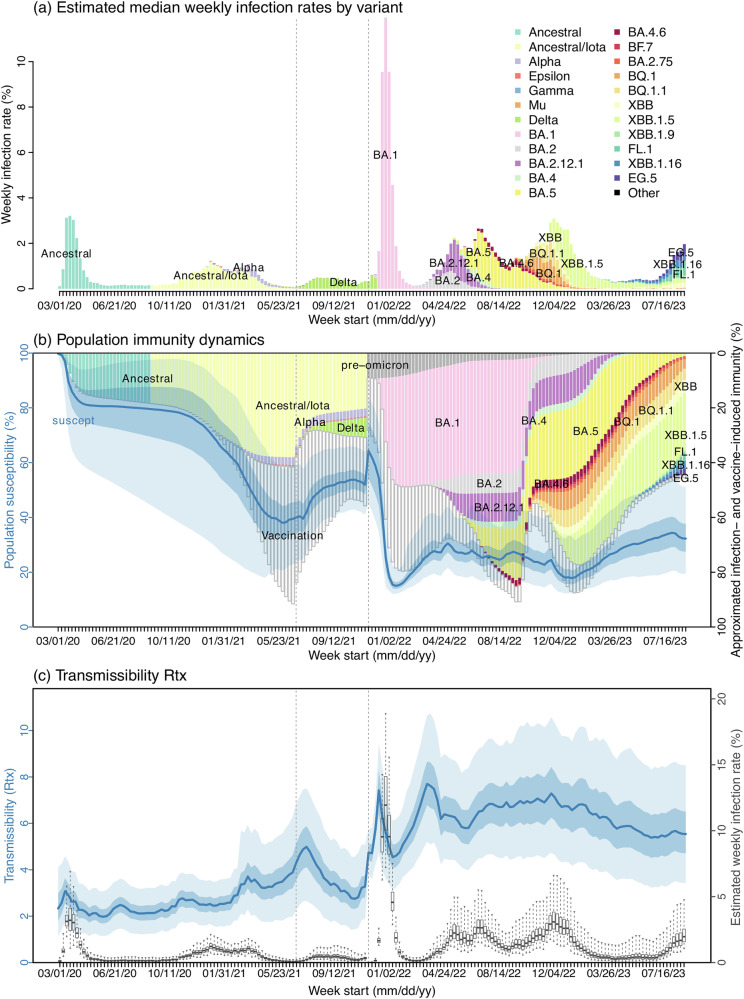
Background: The severe acute respiratory syndrome coronavirus 2 (SARS-CoV-2) has been widespread since 2020 and will likely continue to cause substantial recurring epidemics. However, understanding the underlying infection burden and dynamics, particularly since late 2021 when the Omicron variant emerged, is challenging. Here, we leverage extensive surveillance data available in New York City (NYC) and a comprehensive model-inference system to reconstruct SARS-CoV-2 dynamics therein through August 2023.
Methods: We fit a metapopulation network SEIRSV (Susceptible-Exposed-Infectious-(re)Susceptible-Vaccination) model to age- and neighborhood-specific data of COVID-19 cases, emergency department visits, and deaths in NYC from the pandemic onset in March 2020 to August 2023. We further validate the model-inference estimates using independent SARS-CoV-2 wastewater viral load data.
Results: The validated model-inference estimates indicate a very high infection burden-the number of infections (i.e., including undetected asymptomatic/mild infections) totaled twice the population size ( > 5 times documented case count) during the first 3.5 years. Estimated virus transmissibility increased around 3-fold, whereas estimated infection-fatality risk (IFR) decreased by >10-fold during this period. The detailed estimates also reveal highly complex variant dynamics and immune landscape, and higher infection risk during winter in NYC over the study period.
Conclusions: This study provides highly detailed epidemiological estimates and identifies key transmission dynamics and drivers of SARS-CoV-2 during its first 3.5 years of circulation in a large urban center (i.e., NYC). These transmission dynamics and drivers may be relevant to other populations and inform future planning to help mitigate the public health burden of SARS-CoV-2.
Plain language summary
Severe acute respiratory syndrome coronavirus 2 (SARS-CoV-2) emerged in late 2019, causing the COVID-19 pandemic and multiple epidemics since. Using comprehensive surveillance data and mathematical tools, this study estimated SARS-CoV-2 infection burden and severity over time as well as examined key factors affecting the epidemic patterns, during its first 3.5 years of circulation in New York City. Study findings highlight the emergence of new SARS-CoV-2 strains and higher infection risk in winter as key epidemic drivers during the study period; these may be observed in other populations and could inform future planning to help mitigate the public health burden of SARS-CoV-2.
© 2025. The Author(s).
Conflict of interest statement
Competing interests: The authors declare no conflict of interest.
Figures


Update of
-
SARS-CoV-2 dynamics in New York City during March 2020-August 2023.medRxiv [Preprint]. 2024 Jul 22:2024.07.19.24310728. doi: 10.1101/2024.07.19.24310728. medRxiv. 2024. Update in: Commun Med (Lond). 2025 Apr 7;5(1):102. doi: 10.1038/s43856-025-00826-6. PMID: 39108514 Free PMC article. Updated. Preprint.
References
-
- Harris, E. WHO Declares End of COVID-19 Global Health Emergency. JAMA-J. Am. Med. Assoc.329, 1817 (2023). - PubMed
-
- Global Initiative on Sharing All Influenza Data (GISAID), Tracking of hCoV-19 Variants. https://www.gisaid.org/hcov19-variants/.
Grants and funding
- NU38OT00297/Council of State and Territorial Epidemiologists (CSTE)
- R01 AI145883/AI/NIAID NIH HHS/United States
- AI145883/U.S. Department of Health & Human Services | NIH | National Institute of Allergy and Infectious Diseases (NIAID)
- DMS-2027369/National Science Foundation (NSF)
- R21 AI175747/AI/NIAID NIH HHS/United States
LinkOut - more resources
Full Text Sources
Miscellaneous
