. 2025 May;44(10):2906-2927.
doi: 10.1038/s44318-025-00430-3. Epub 2025 Apr 7.

The selenocysteine-containing protein SELENOT maintains dopamine signaling in the midbrain to protect mice from hyperactivity disorder

Affiliations

The selenocysteine-containing protein SELENOT maintains dopamine signaling in the midbrain to protect mice from hyperactivity disorder

Qing Guo et al. EMBO J. 2025 May.

Abstract

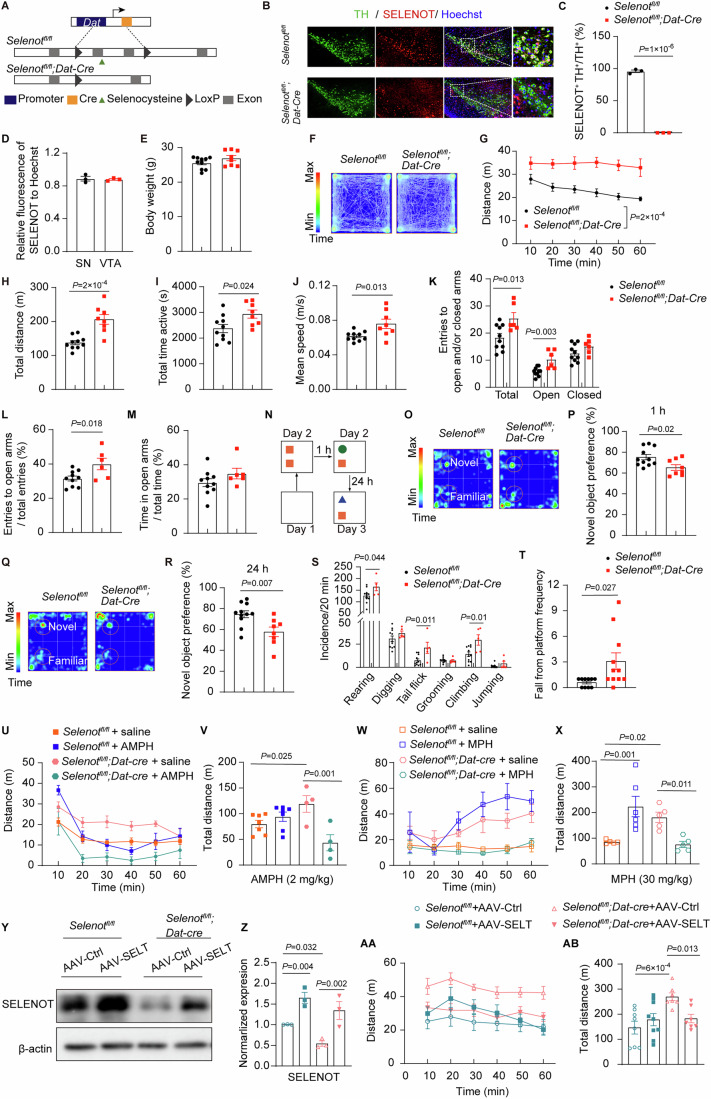
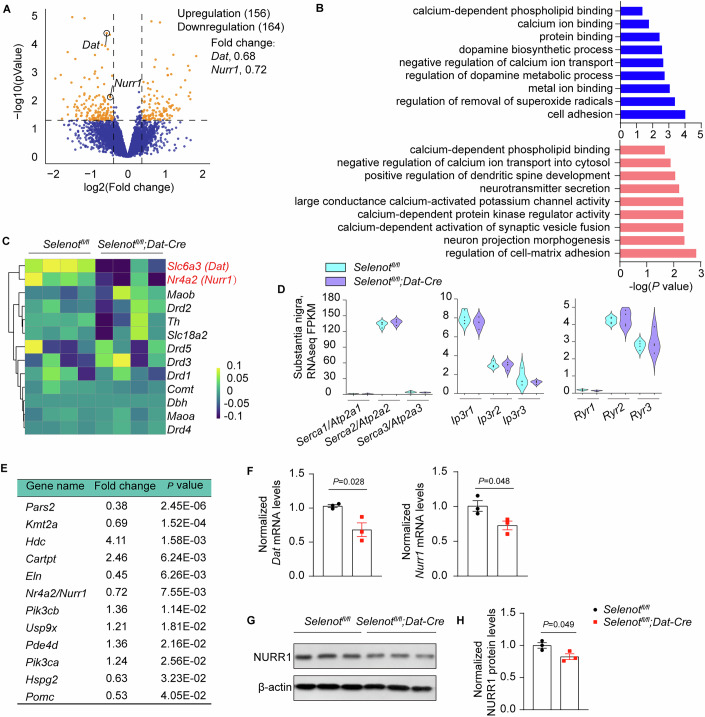
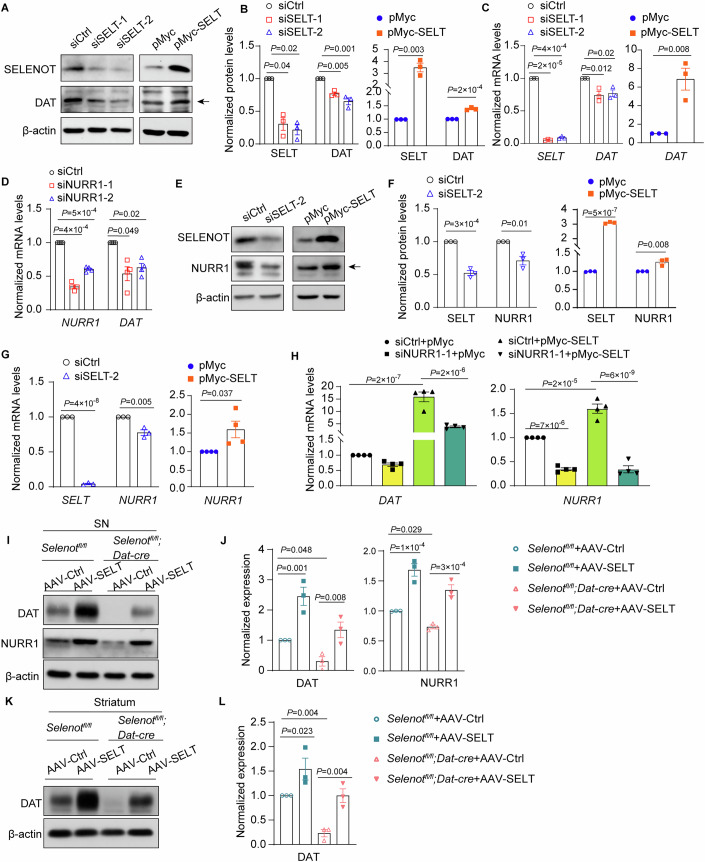
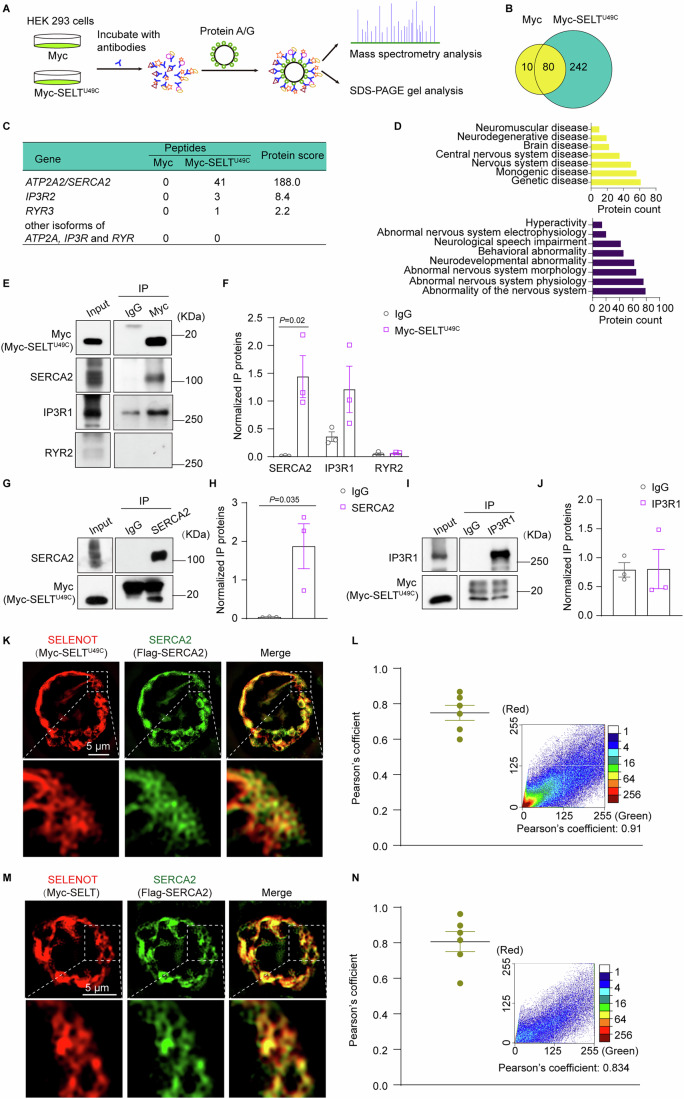
Dopaminergic neuron dysfunction has been implicated in multiple neurological and psychiatric disorders. SELENOT is a selenocysteine-containing protein of the ER membrane with antioxidant and neuroprotective activities, but its pathophysiological role in dopaminergic neurons remains unclear. In this study we show that male mice with SELENOT-deficient dopaminergic neurons exhibit attention deficit/hyperactivity disorder (ADHD)-like symptoms, including hyperlocomotion, recognition memory deficits, repetitive movements, and impulsivity. Dopamine metabolism, extrasynaptic dopamine levels, spontaneous excitatory postsynaptic currents in the striatum, and electroencephalography theta power are all enhanced in these animals, while dopaminergic neurons in the substantia nigra are slightly reduced but with normal firing and cellular stress levels. Our results also indicate that the expression of dopamine transporter (DAT) is significantly reduced in the absence of SELENOT. Both the development of ADHD-like phenotypes and DAT downregulation are also observed when SELENOT is absent from the whole brain, but not when its conditional knockout is restricted to astrocytes. Mechanistically, we show that SELENOT downregulates DAT expression via interaction with SERCA2 of the ER -but not with IP3R or RYR- to regulate the ER-cytosol Ca2+ flux and, subsequently, the activity of transcription factor NURR1 and the expression levels of DAT. Treatment with amphetamine or methylphenidate, which are commonly used to treat ADHD, reverses the hyperactivity observed in mice with SELENOT-deficient dopaminergic neurons. Our study demonstrates that SELENOT in mouse dopaminergic neurons maintains proper dopamine signaling in the midbrain against the development of ADHD-like behaviors.

Keywords: Attention Deficit/Hyperactivity Disorder; Calcium; Dopamine Transporter; Dopaminergic Neurons; SELENOT.


Conflict of interest statement

Disclosure and competing interests statement. The authors declare no competing interests.

Figures

Figure 1
Figure 1. Selenotfl/fl;Dat-cre mice exhibit hyperlocomotion and impaired memory.
(A) Schematic diagram of Dat promoter-driven excision of Selenot exons 2 and 3. (BD) Immunofluorescence analyses of SELENOT expression in dopaminergic neurons in Selenotfl/fl (n = 3) and Selenotfl/fl;Dat-cre (n = 3) mice. Presented are the representative images (B), the percentage of SELENOT and TH colocalized cells relative to TH-positive cells (C), and relative fluorescence intensity of SELENOT to the nuclei staining in the SN and VTA (D). Green, TH; red, SELENOT; blue, Hoechst. (E) Body weight of Selenotfl/fl (n = 10) and Selenotfl/fl;Dat-cre (n = 8) mice at 8 weeks of age. (FJ) Open field test of Selenotfl/fl (n = 10) and Selenotfl/fl;Dat-cre (n = 8) mice. Presented are representative activity heatmap (F), distance traveled every 10 min (G), total distance traveled (H), total active time (I), and mean speed (J). (KM) Elevated plus maze test of Selenotfl/fl (n = 10) and Selenotfl/fl;Dat-cre (n = 6) mice. Presented are entries to total, open, and closed arms (K), percentage of entries to open arms compared to total entries (L), and percentage of time spent in open arms to total time spent in open and closed arms (M). (NR) Novel object recognition test of Selenotfl/fl (n = 11) and Selenotfl/fl;Dat-cre (n = 8) mice. Presented are schematic diagram (N), representative activity heatmap, and novel object preference in short-term memory (1 h; O, P) and long-term memory (24 h; Q, R). (S) Stereotyped behaviors of Selenotfl/fl (n = 11) and Selenotfl/fl;Dat-cre (n = 5) mice. (T) Fall from platform frequencies of Selenotfl/fl (n = 10) and Selenotfl/fl;Dat-cre (n = 11) mice in the cliff avoidance reaction test. (U, V) Open field test of mice treated with saline or 2 mg/kg AMPH. n = 7 Selenotfl/fl + saline mice, 7 Selenotfl/fl + AMPH mice, 4 Selenotfl/fl;Dat-cre + saline mice, and 4 Selenotfl/fl;Dat-cre + AMPH mice. (W, X) Open field test of mice treated with saline or 30 mg/kg MPH. n = 5 Selenotfl/fl + saline mice, 6 Selenotfl/fl + MPH mice, 5 Selenotfl/fl;Dat-cre + saline mice, and 5 Selenotfl/fl;Dat-cre + MPH mice. Presented are locomotor activity every 10 min (U, W) and total distance for 60 min (V, X). (Y, Z) Western blot analyses (Y) and quantifications (Z) of SELENOT in the substantia nigra of mice infected with AAVs. n = 3 mice for each group. Quantifications are normalized to β-actin. (AA, AB) Open field test of mice infected with AAVs. n = 8 Selenotfl/fl + AAV-Ctrl mice, 9 Selenotfl/fl + AAV-SELT mice, 7 Selenotfl/fl;Dat-cre + AAV-Ctrl mice, and 7 Selenotfl/fl;Dat-cre + AAV-SELT mice. Presented are locomotor activity every 10 min (AA) and total distance for 60 min (AB). Data are presented as means ± SEM and analyzed by two-way repeated measures ANOVA for (G), factorial ANOVA for (V, X, Z, and AB), and two-tailed unpaired t-test for other comparisons. AAV adeno-associated virus; AAV-Ctrl control AAV AAV-SELT SELENOT-expressing AAV, AMPH amphetamine, MPH methylphenidate, SN substantia nigra, TH tyrosine hydroxylase, VTA ventral tegmental area. Source data are available online for this figure.
Figure 2
Figure 2. Impaired DA metabolism and reuptake in Selenotfl/fl;Dat-cre mice.
(AE) HPLC analyses of striatal neurotransmitters, including DA (A), GABA (B), Ach (C), 5-HT (D), and NE (E). (F) Ratio of DA metabolites to DA. n = 7 Selenotfl/fl mice and 10 Selenotfl/fl;Dat-cre mice. (G, H) DA levels measured in the striatum by microdialysis in freely moving Selenotfl/fl (n = 3) and Selenotfl/fl;Dat-cre (n = 3) mice. Presented are schematic diagram (G) and HPLC-analyzed DA levels (H). (I, J) HPLC analyses of striatal glutamate (I) and 5-HIAA (J) levels. Data are presented as means ± SEM and analyzed by two-way repeated measures ANOVA for (H) and two-tailed unpaired t-test for (AF, I, J). 3-MT, 3-methoxytyramine; 5-HT, 5-hydroxytryptamine; 5-HIAA, 5-hydroxyindoleacetic acid; Ach, acetylcholine; DA, dopamine; DOPAC, 3,4-dihydroxyphenylacetic acid; GABA, γ-aminobutyric acid; HVA, homovanillic acid; NE, norepinephrine. Source data are available online for this figure.
Figure 3
Figure 3. Selenotfl/fl;Dat-cre mice display normal dopaminergic neuron firing but elevated postsynaptic excitatory input and EEG theta power.
(A) Representative images showing that the recorded neurons (white arrows) were positive for TH (green) on a polyoxymethylene-fixed brain slice after patching. Biocytin (red) was diffused into cells by whole-cell patch clamp. Scale bar, 50 μm. (BD) Action potential of dopaminergic neurons. Presented are representative action potential recorded under current clamp mode (B), and quantified thresholds (C) and amplitudes (D) of action potentials. n = 26 neurons recorded from 8 Selenotfl/fl mice and 22 neurons recorded from 8 Selenotfl/fl;Dat-cre mice. (EG) sEPSC in the striatum. Presented are representative recordings of sEPSC (E), and quantified frequencies (F) and amplitudes (G) of striatal medium spiny neurons. n = 15 neurons recorded from 4 Selenotfl/fl mice and 18 neurons recorded from 3 Selenotfl/fl;Dat-cre mice. (HK) EEG analysis. Presented are representative spectrogram (H) and traces (I), and mean EEG power spectral density (J) and theta power (K) over 60 min. n = 4 Selenotfl/fl mice and 4 Selenotfl/fl;Dat-cre mice. Data are presented as means ± SEM and analyzed by two-tailed unpaired t-test. EEG, electroencephalogram; sEPSC, spontaneous excitatory postsynaptic currents; TH, tyrosine hydroxylase; Vthreshold, threshold of action potential. Source data are available online for this figure.
Figure 4
Figure 4. Altered expression of dopamine signaling-associated proteins in Selenotfl/fl;Dat-cre mice.
(A, B) Western blot analyses (A) and quantifications (B) of proteins in the dorsal and ventral striatum. The order in (B) corresponds to that in (A). The arrow indicates the band for VMAT2. The β-actin controls were from the same or other gels run in parallel. n = 3 Selenotfl/fl mice and 3 Selenotfl/fl;Dat-cre mice. (CF) Immunohistochemical analyses (C, E) and optical density quantifications (D, F) of DAT and TH in the striatum. n = 3–4 Selenotfl/fl mice and 3 Selenotfl/fl;Dat-cre mice. (G, H) Western blot analyses (G) and quantifications (H) of TH and DAT in the midbrain. The β-actin controls were from the same or other gels run in parallel. n = 3 Selenotfl/fl mice and 3 Selenotfl/fl;Dat-cre mice. (I, J) Immunofluorescence (I) and counts (J) of dopaminergic neurons in the midbrain. n = 5 Selenotfl/fl mice and 5 Selenotfl/fl;Dat-cre mice. (K, L) Immunofluorescence (K) and cellular quantifications (L) of TH expression in dopaminergic neurons. n = 4 Selenotfl/fl mice and 4 Selenotfl/fl;Dat-cre mice. Quantifications are normalized to β-actin for Western blot. Each immunostaining quantification was averaged from 2 to 3 consecutive slices. Data are presented as means ± SEM and analyzed by two-tailed unpaired t-test. COMT catechol-O-methyltransferase, DAT dopamine transporter; D2R dopamine D2 receptor, MAO-A monoamine oxidase A, MAO-B monoamine oxidase B, SN substantia nigra, SNpc substantia nigra pars compacta, TH tyrosine hydroxylase, VMAT2 vesicular monoamine transporter 2, VTA ventral tegmental area. Source data are available online for this figure.
Figure 5
Figure 5. RNA sequencing analysis of the substantia nigra in Selenotfl/fl;Dat-cre mice comparing to Selenotfl/fl mice.
(A) Volcano plot of DEGs. Fold change >1.2, P < 0.05. Data were analyzed by Wald test. (B) Gene Ontology analysis for the DEGs. Data were analyzed by hypergeometric test. Blue, downregulated; Pink, upregulated. (C) Row-normalized RNA-seq heatmap for dopaminergic signaling-related genes. (D) Violin plot of RNA-seq FPKMs for Atp2a/Serca, Ip3r, and Ryr isoforms. (E) List of ADHD candidate DEGs identified by DisGenet. This database contains a total of 842 genes. (F) qPCR validation of Dat and Nurr1 mRNA expression in the substantia nigra. (G, H) Western blot analysis (G) and quantifications (H) of NURR1 protein levels in the substantia nigra. n = 3 Selenotfl/fl mice and 3 Selenotfl/fl;Dat-cre mice. Quantifications are normalized to β-actin for qPCR and Western blot. Data are presented as means ± SEM and analyzed by two-tailed unpaired t-test for (F, H). DEG, differentially expressed gene; FPKM, fragments per kilobase per million. Source data are available online for this figure.
Figure 6
Figure 6. Regulation of SELENOT on DAT and NURR1 expression.
(AC) Western blot analyses (A) and quantifications (B), and qPCR analyses (C) for DAT or SELENOT protein and mRNA levels in HEK293 cells transfected with siSELT-1, siSELT-2, siCtrl, pMyc-SELT, or pMyc (48 h for qPCR and 72 h for Western blot). The arrow indicates the band for DAT. n = 3 independent experiments. (D) Validation of the transcriptional regulation of DAT expression by NURR1. HEK293 cells were transfected with siNURR1-1, siNURR1-2 or siCtrl for 48 h. n = 4 independent experiments. (EG) Western blot analyses (E) and quantifications (F), and qPCR analyses (G) for NURR1 protein and mRNA levels in HEK293 cells transfected with siSELT-2, siCtrl, pMyc-SELT, or pMyc (48 h for qPCR and 72 h for Western blot). The arrow indicates the band for NURR1. n = 3-4 independent experiments. (H) qPCR analyses for the effect of NURR1 on the SELENOT-induced DAT expression. Cells were pre-transfected with siNURR1 or siCtrl for 24 h, followed by transfection with pMyc-SELT or pMyc for 48 h. n = 4 independent experiments. Quantifications are normalized to their respective controls after normalization to β-actin for qPCR and Western blot. (I, J) Western blot analyses (I) and quantifications (J) of DAT and NURR1 in the substantia nigra. The β-actin controls were from the same or other gels run in parallel. (K, L) Western blot analyses (K) and quantifications (L) of DAT in the whole striatum. The Selenotfl/fl and Selenotfl/fl;Dat-cre mice were infected with AAV-Ctrl or AAV-SELT. n = 3 mice for each group. Quantifications are normalized to β-actin. Data are presented as means ± SEM and analyzed by one-way ANOVA followed by Dunnett’s post hoc test for (left panels of B and C, and D), factorial ANOVA for (H, J, and L), and two-tailed unpaired t-test for other comparisons. AAV adeno-associated virus, AAV-Ctrl control AAV, AAV-SELT SELENOT-expressing AAV, DAT dopamine transporter, NURR1 nuclear receptor-related 1, pMyc pCMV-Myc empty vector, pMyc-SELT Myc-tagged SELENOT vector, siCtrl scramble siRNA, siNURR1 NURR1 siRNA, siSELT SELENOT siRNA. Source data are available online for this figure.
Figure 7
Figure 7. SELENOT modulates ER-cytosol Ca2+ influx via SERCA.
(AE) Cytosolic Ca2+ level analyses of HEK293 cells transfected with siRNA for 48 h. Presented are representative images (A), steady-state levels (B), CPA-induced peaks (C), caffeine-induced peaks (D), and AdA-induced peaks (E). Data were quantified from 3 independent experiments: n = 27 siCtrl and 30 siSELT-2 cells for (B), n = 30 siCtrl and 29 siSELT-2 cells for (C), n = 32 siCtrl and n = 29 siSELT-2 cells for (D), n = 13 siCtrl and n = 13 siSELT-2 cells for (E). Scale bar, 50 μm. (FH) Cytosolic Ca2+ level analyses of HEK293 cells transfected with plasmid for 48 h. Presented are representative images (F), steady-state levels (G), and CPA-induced peaks (H). Data were quantified from 3 independent experiments: n = 36 pMyc and 26 pMyc-SELT cells for (G), n = 65 pMyc and 58 pMyc-SELT cells for (H). Scale bar, 50 μm. (I, J) Time- (I) and dose-dependent (J) effects of CPA on DAT and NURR1 expression. HEK293 cells were treated with 50 μM CPA for different time (I), or with different dose of CPA for 24 h (J). Quantifications are normalized to β-actin. n = 5 independent experiments. (K) Effect of CPA treatment on DAT and NURR1 expression in SELENOT pre-knockdown cells. Quantifications are normalized to β-actin. n = 4 independent experiments. (LN) Cytosolic Ca2+ level analyses of substantia nigra slices from mice injected with cre-initiated AAV-GCaMP. Presented are the injection diagram and representative images (L), steady-state levels (M), and CPA-induced peaks (N). Data were quantified from 3 Dat-cre and 3 Selenotfl/fl;Dat-cre mice: n = 36 Dat-cre and 25 Selenotfl/fl;Dat-cre cells for (M), n = 38 Dat-cre and 27 Selenotfl/fl;Dat-cre cells for (N). Red (Tdtomato) labels nuclei. Quantifications of GCaMP are normalized to Tdtomato. Scale bar, 100 μm. Data are presented as means ± SEM and analyzed by one-way ANOVA followed by Dunnett’s post hoc test for (I, J), factorial ANOVA for (K), and two-tailed unpaired t-test for other comparisons. AAV adeno-associated virus, AdA adenophostin A, CPA cyclopiazonic acid, pMyc pCMV-Myc empty vector, pMyc-SELT Myc-tagged SELENOT vector, siCtrl scramble siRNA, siSELT SELENOT siRNA. Source data are available online for this figure.
Figure 8
Figure 8. SELENOT interacts with SERCA2, but not IP3R1 or RYR2.
(A) Schematic diagram illustrating the identification of SELENOT-interacting proteins. (B) Venn diagram of proteins identified by mass spectrometry of immunoprecipitants from Myc and Myc-SELTU49C. Numbers indicate number of proteins pulled down with each bait protein (Protein score > 30). (C) Enriched peptide numbers and protein scores for ATP2A/SERCA, IP3R, and RYR isoforms. (D) Clustering of enriched human phenotypes and diseases among the 242 unique SELENOT-interacting proteins. (E, F) Immunoprecipitation with Myc-SELTU49C to detect SERCA2, IP3R1 and RYR2. (GJ) IP with SERCA2 or IP3R1 to detect Myc-SELTU49C. HEK293 cells were transfected with pMyc-SELTU49C or pMyC for 48 h. Presented are the representative blots (E, G, I) and quantifications normalized to the non-IgG bait (F, H, J). n = 3 independent experiments. (KN) Colocalization analyses of SERCA2 with Myc-SELTU49C and Myc-SELT. HEK293 cells were co-transfected with plasmids pFlag-SERCA and pMyc-SELTU49C or pMyc-SELT for 48 h. Presented are the representative colocalization images (K, M), and representative Pearson’s coefficient analysis with the calculated values (L, N). n = 6 cells from 3 independent experiments. Data are presented as means ± SEM and analyzed by two-tailed unpaired t-test. flag-SERCA flag-tagged SERCA, IP immunoprecipitation, IP3R inositol 1,4,5-triphosphate receptor, pFlag-SERCA2 Flag-tagged SERCA2 vector, pMyc pCMV-Myc empty vector, pMyc-SELT Myc-tagged SELENOT vector, pMyc-SELTU49C Myc-tagged SELENOTU49C vector, RYR ryanodine receptor, SERCA sarco-ER Ca2+ ATPase. Source data are available online for this figure.
Figure 9
Figure 9. Working model for SELENOT deficiency inducing ADHD-like behaviors.
DAT dopamine transporter, DOPAC 3,4-dihydroxyphenylacetic acid, DA dopamine, EEG electroencephalogram, MAO-A monoamine oxidase, NURR1 nuclear receptor-related 1, SELENOT selenoprotein T, SERCA2 sarco-ER Ca2+ ATPase 2, sEPSC spontaneous excitatory postsynaptic currents, VMAT2 vesicular monoamine transporter 2.

References

    1. Andrade A, Brennecke A, Mallat S, Brown J, Gomez-Rivadeneira J, Czepiel N, Londrigan L (2019) Genetic associations between voltage-gated calcium channels and psychiatric disorders. Int J Mol Sci 20:3537 - PMC - PubMed
    1. Bagur R, Hajnoczky G (2017) Intracellular Ca(2+) sensing: its role in calcium homeostasis and signaling. Mol Cell 66:780–788 - PMC - PubMed
    1. Boukhzar L, Hamieh A, Cartier D, Tanguy Y, Alsharif I, Castex M, Arabo A, El Hajji S, Bonnet JJ, Errami M et al (2016) Selenoprotein T exerts an essential oxidoreductase activity that protects dopaminergic neurons in mouse models of Parkinson’s disease. Antioxid Redox Signal 24:557–574 - PMC - PubMed
    1. Cases O, Seif I, Grimsby J, Gaspar P, Chen K, Pournin S, Muller U, Aguet M, Babinet C, Shih JC et al (1995) Aggressive behavior and altered amounts of brain serotonin and norepinephrine in mice lacking MAOA. Science 268:1763–1766 - PMC - PubMed
    1. Castex MT, Arabo A, Benard M, Roy V, Le Joncour V, Prevost G, Bonnet JJ, Anouar Y, Falluel-Morel A (2016) Selenoprotein T deficiency leads to neurodevelopmental abnormalities and hyperactive behavior in mice. Mol Neurobiol 53:5818–5832 - PubMed

MeSH terms

Substances

LinkOut - more resources