[Preprint]. 2025 Mar 25:rs.3.rs-5588592.
doi: 10.21203/rs.3.rs-5588592/v1.

Evolving epigenomics of immune cells in type 1 diabetes at single nuclei resolution

Affiliations

Evolving epigenomics of immune cells in type 1 diabetes at single nuclei resolution

Tomi Pastinen et al. Res Sq. .

Abstract

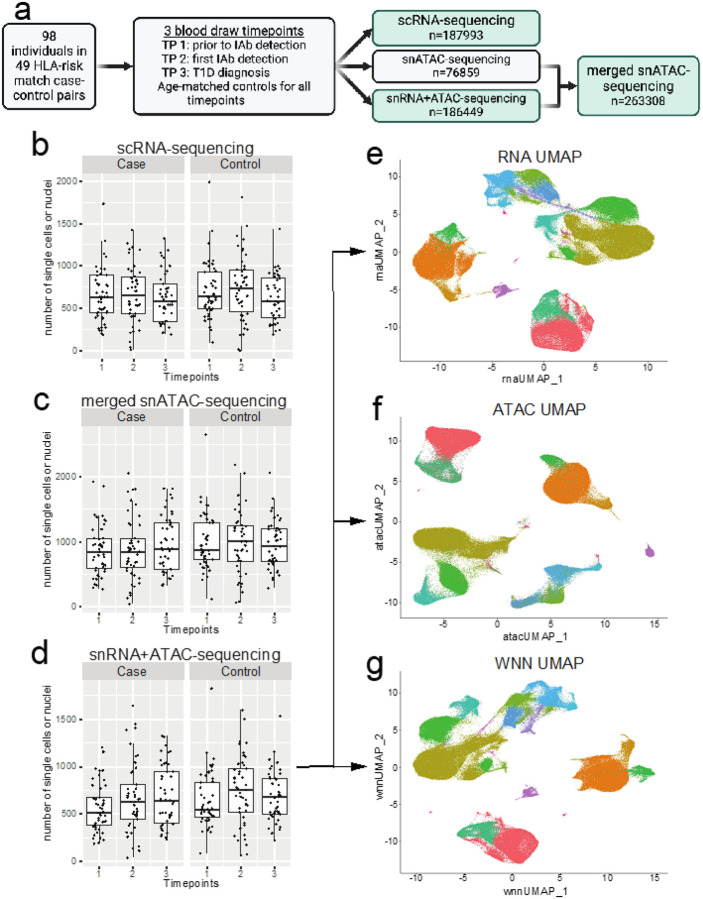
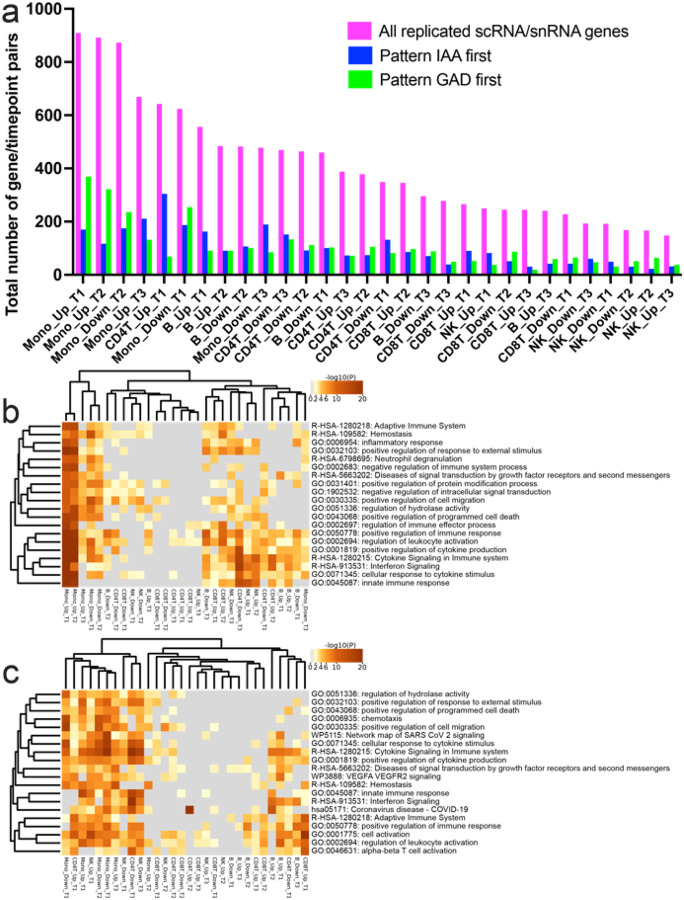
The appearance of diabetes-associated autoantibodies is the first detectable sign of the disease process leading to type 1 diabetes (T1D). Evidence suggests that T1D is a heterogenous disease, where the type of antibodies first formed imply subtypes. Here, we followed 49 children, who subsequently presented with T1D and 49 matched controls, profiling single-cell epigenomics at different time points of disease development. Quantitation of cell and nuclei populations as well as transcriptome and open-chromatin states indicated robust, early, replicable monocyte lineage differences between cases and controls, suggesting heightened pro-inflammatory cytokine secretion early among cases. The order of autoantibody emergence in cases showed variation across lymphoid and myeloid cells, potentially indicating cellular immune response divergence. The strong monocytic lineage representation in peripheral blood immune cells before seroconversion and the weaker differential coordination of these gene networks close to clinical diagnosis emphasizes the importance of early life as a critical phase in T1D development.


Conflict of interest statement

COMPETING INTERESTS The authors declare no competing interests.

Figures

Figures 1
Figures 1
a) Overall study design and retained, quality controlled (QC), singleton samples from single nuclei (sn) and single-cell (sc) RNA (snRNA/scRNA) and open chromatin (snATAC) sequencing. b-d) QC’d nuclei and single-cell counts per time point in cases and controls. e-g) Major cell clusters from snMultiome nuclei in individual snRNA (e) and snATAC (f) or merged data (g) in Seurat/Signac analyses.
Figures 2
Figures 2
SnMultiome analyses by Signac reveals linked open-chromatin and nuclear RNA expression states in peripheral blood mononuclear cells from cases and controls at risk for T1D through early infancy to school-age years. a) Initial set of 31,397 peaks – gene links (Table 2) from snMultiome was replicated in independent snATAC and scRNA analyses from same cohort of cases and controls. Over half of the nominally significant links showed concordant behavior in the replication test at absolute pearson r > 0.65. The distribution of replication pearson correlations depicted on the histogram show correlation distribution skewed to the right indicating predominantly positive relationships with chromatin openness and gene expression levels. b) Example from chemokine locus in chr17 from snMultiome peak – gene link analyses showing open chromatin profiles across collapsed cell lineages (top left) together with linked gene expression levels (top right). Read depths for snATAC are shown as fragment count graphs (middle) and the significant peak/gene pairs called by Signac are shown in arcs (bottom).
Figure 3
Figure 3
Taking advantage of the study design with layers of data and multiple time points we queried the orthogonal data layers (time point, snRNA, scRNA, snATAC) for independent replication of each case-control association. a-b) The highest rate of replication is observed for scRNA, 45.6% seen it at least 2 layers of data, whereas 40.2% of more abundant snRNA signals are replicated. Much of the higher replication rate in scRNA is explained by consistent signals from ribosomal RNAs representing 6.0% of all replicated data points, whereas in snRNA only 1.4% of 2-layer positive case – control differences are mapping to ribosomal transcripts. This reflects the cytosolic scRNA overall molecular composition, with high proportion of ribosomal RNA reads, largely absent in snRNA (Supplementary Figure 3). c) Open chromatin features, have lower discovery with less read coverage per snATAC peaks. Overall the median feature by group (case/control) read depths shown in the graphs panel correlate with replication level (r = 0.79 for ATAC, r = 0.82 for snRNA and r = 0.99 for scRNA).
Figure 4
Figure 4
Proinflammatory monocyte signatures early monocyte-specific regulation in T1D cases vs controls. a) Input to enrichment analyses by Metascape were genes represented by snRNA/scRNA features and replicated in at least one data layer including a total of 2,470 monocyte genes showing relative upregulation in cases vs. controls (Mono_Up) across 3 time points and 1,975 relatively downregulated genes (Mono_Down), 1,408 up -and 1,282 down-regulated genes in CD4 T-cells (CD4T_Up/CD4T_Down) as well as 1,281/1,238 B_Up/B_Down, 857/751 CD8T_Up/CD8T_Down and 565/553 NK_Up/NK_Down genes. b) Upstream regulator analyses of genes using TRRUST.c) Using 2-by-2 tests (Fisher’s exact test) we determined significant differences in representation of individual motifs from TF motif in cases vs. controls and required nominal P<0.01 for difference between open and closed chromatin peaks. d) Differentially regulated gene networks between cases and controls revealed by gene – peak link analyses (Figure 2) similarly highlight predominant strong predominance of early monocyte lineage responses as key differentiator.
Figure 5
Figure 5
a) Number of significant (y-axis) case vs. control signals (lavender bars) at each cell type / time point (x-axis) also significant in differential analyses of IAA first (blue bars) vs. GAD first (green bars). Early monocyte time points T1 / T2 patterns are showing most similarity to GAD first patterns. Proportionally CD8 T2 case patterns appear also to be originating more from GAD first subpopulation of cases. b) Pathway analysis for GAD first vs. matched controls shows that large fraction of case activated pathways at early monocyte time points are predominanty active among GAD first endophenotype. Direction of effect (column labels) are based on GAD first expression as compared controls. c) Pathway analysis for IAA first vs. matched controls is showing less remarkable enrichment in monocyte overexpressed pathways, but upregulated genes at first timepoint of CD4T cells with high overlap of overall case – control differences (a) points to pathways linked to adaptive immunity. Direction of effect (column labels) are based on IAA first expression as compared controls.

References

    1. Aly T. A. et al. Genetic prediction of autoimmunity: initial oligogenic prediction of anti-islet autoimmunity amongst DR3/DR4-DQ8 relatives of patients with type 1A diabetes. J Autoimmun 25 Suppl, 40–45, doi:10.1016/j.jaut.2005.09.002 (2005). - DOI - PubMed
    1. Noble J. A. & Valdes A. M. Genetics of the HLA region in the prediction of type 1 diabetes. Curr Diab Rep 11, 533–542, doi:10.1007/s11892-011-0223-x (2011). - DOI - PMC - PubMed
    1. Bonifacio E. & Ziegler A. G. Advances in the prediction and natural history of type 1 diabetes. Endocrinol Metab Clin North Am 39, 513–525, doi:10.1016/j.ecl.2010.05.007 (2010). - DOI - PubMed
    1. Robertson C. C. et al. Fine-mapping, trans-ancestral and genomic analyses identify causal variants, cells, genes and drug targets for type 1 diabetes. Nat Genet 53, 962–971, doi:10.1038/s41588-021-00880-5 (2021). - DOI - PMC - PubMed
    1. Qu H. Q. et al. Improved genetic risk scoring algorithm for type 1 diabetes prediction. Pediatr Diabetes 23, 320–323, doi:10.1111/pedi.13310 (2022). - DOI - PMC - PubMed

Publication types

LinkOut - more resources