[Preprint]. 2025 Mar 30:2025.03.28.25324850.
doi: 10.1101/2025.03.28.25324850.

Whole-Genome Sequencing Reveals Individual and Cohort Level Insights into Chromosome 9p Syndromes

Yingxi Wang  1 Eleanor I Sams  1 Rachel Slaugh  2 Sandra Crocker  3 Emily Cordova Hurtado  1 Sophia Tracy  2 Ying-Chen Claire Hou  3 Christopher Markovic  4 Kostandin Valle  1 Victoria Tate  2 Khadija Belhassan  3 Elizabeth Appelbaum  4 Titilope Akinwe  1   5   6 Rodrigo Starosta Tzovenos  2 Yang Cao  3 Amber Neilson  4 Yu Liu  1 Nathaniel Jensen  2 Reza Ghasemi  3 Tina Lindsay  4 Juana Manuel  1 Sophia Couteranis  2 Milinn Kremitzki  4 Jack Ustanik  1 Thomas Antonacci  4 Jeffrey K Ng  1 Andrew Emory  4 Laura Metz  1 Tracie DeLuca  4 Katherine N Lyons  1 Toni Sinnwell  4 Brianne Thomeczek  4 Kymme Wang  7 Nick Sisneros  8 Megha Muraleedharan  8 Anantha Kethireddy  8 Marco Corbo  8 Harsha Gowda  8 Katherine King  2 Christina A Gurnett  9 Susan K Dutcher  1 Catherine Gooch  2 Yang E Li  1   10 Matthew W Mitchell  11 Kevin A Peterson  12 Amjad Horani  2 Jill A Rosenfeld  13   14 Weimin Bi  13   14 Pawel Stankiewicz  13 Hsiao-Tuan Chao  13 Jennifer Posey  13 Christopher M Grochowski  13   15 Zain Dardas  13 Erik Puffenberger  16 Christopher E Pearson  17 Frank Kooy  18 Dale Annear  18 A Micheil Innes  19 Michael Heinz  4 Richard Head  4 Robert Fulton  4 Stephan Toutain  20 9P-ARCHLucinda Antonacci-Fulton  4 Xiaoxia Cui  4 Robi D Mitra  1   4 F Sessions Cole  2 Julie Neidich  3 Patricia I Dickson  2 Jeffrey Milbrandt  1   4   21 Tychele N Turner  1
Affiliations

Whole-Genome Sequencing Reveals Individual and Cohort Level Insights into Chromosome 9p Syndromes

Yingxi Wang et al. medRxiv. .

Abstract

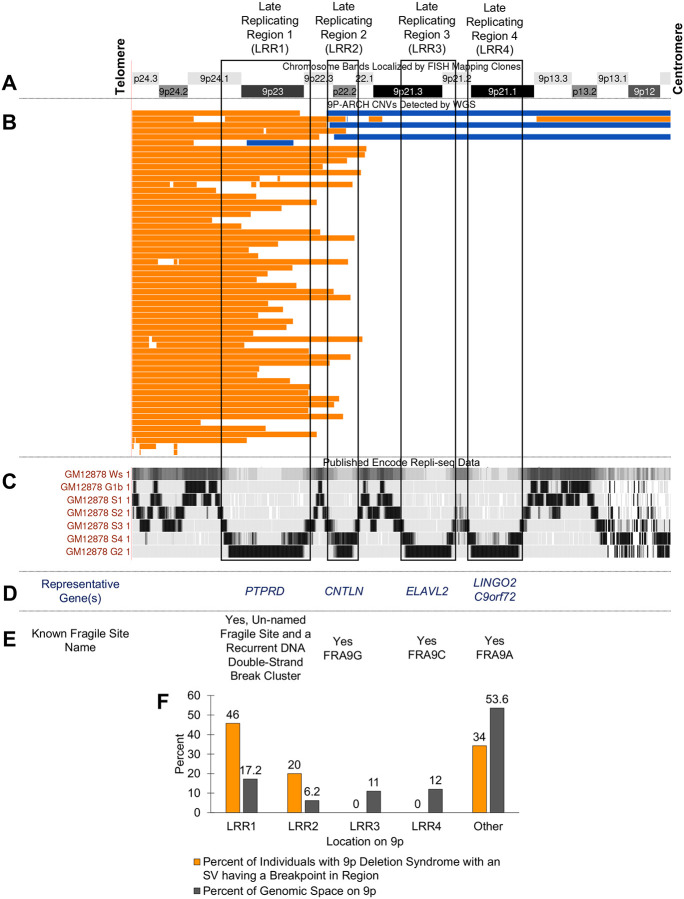
Previous genomic efforts on chromosome 9p deletion and duplication syndromes have utilized low resolution strategies (i.e., karyotypes, chromosome microarrays). We present the first large-scale whole-genome sequencing (WGS) study of 100 individuals from families with 9p-related syndromes including 85 unrelated probands through the 9P-ARCH (Advanced Research in Chromosomal Health: Genomic, Phenotypic, and Functional Aspects of 9p-Related syndromes) research network. We analyzed the genomic architecture of these syndromes, highlighting fundamental features and their commonalities and differences across individuals. This work includes a machine-learning model that predicts 9p deletion syndrome from gene copy number estimates using WGS data. Two Late Replicating Regions (LRR1 [a previously un-named human fragile site], LRR2) were identified that contain most structural variant breakpoints in 9p deletion syndrome pointing to replication-based issues in structural variant formation. Furthermore, we show the utility of using WGS information to obtain a comprehensive understanding of 9p-related variation in an individual with complex structural variation where chromothripsis is the likely mechanism. Genes on 9p were prioritized based on statistical assessment of human genomic variation. Furthermore, through application of spatial transcriptomics to embryonic mouse tissue we examined 9p-gene expression in craniofacial and brain development. Through these strategies, we identified 24 important genes for the majority (83%) of individuals with 9p deletion syndrome including AK3, BRD10, CD274, CDC37L1, DMRT1, DMRT2, DMRT3, DOCK8, GLIS3, JAK2, KANK1, KDM4C, PLPP6, PTPRD, PUM3, RANBP6, RCL1, RFX3, RIC1, SLC1A1, SMARCA2, UHRF2, VLDLR, and ZNG1A. Two genes (AK3, ZNG1A) are involved in mitochondrial function and testing of the mitochondrial genome revealed excess copy number in individuals with 9p deletion syndrome. This study presents the most comprehensive genomic analysis of 9p-related syndromes to date, with plans for further expansion through our 9P-ARCH research network.


Figures

Figure 1:
Figure 1:. Genomic Architecture of 9p-Related Syndromes.
Each point, in this principal component analysis of genic copy number on 9p, represents an individual either sequenced in this study as part of a family with 9p-related syndromes or from the 1000 Genomes Project (controls). The individuals from the 1000 Genomes Project cluster in the center of this plot. Small schematics of the p-arm are shown in rectangles with tel indicating telomere and cen indicating centromere. Orange represents deletion and blue represents duplication. This PCA reveals the complexity of what is called a 9p deletion syndrome (all the individuals with orange) and what is called a 9p duplication syndrome (all the individuals with blue). This kind of map is critical for researchers and families to connect with each other based on similar genomic events and for future refined care, beyond research, and into the clinic.
Figure 2.
Figure 2.. Complex Structural Variation Detected in 9p.123.p1.
A) Shown is the karyotype of individual 9p.123.p1 where abnormalities were detected involving chromosome 8, chromosome 9, chromosome 11, and chromosome 13. B) Shown is the detailed characterization of the complex variation involving chromosome 8, chromosome 9, and chromosome 3 as detected using short-read whole-genome sequencing. A = 8q del 1 breakpoint 1 (chr8:105,028,001; linked to Bright). Bright = right (centromere) side of region B (chr9:8,384,167; linked to A). Bleft = left (telomere) side of region B; inverted reads at chr9:8,384,164; linked to Ileft. C = 8q del 2 breakpoint 2 (chr8:107,839,946; linked to Dleft). Dright = chr3:166,346,923 (linked to Kleft). Dleft = chr3:166,346,922 (linked to C). E = 8q del 2 breakpoint 1 (chr8:114,357,399; linked to Fright). Fright = right (telomere) side of region F (chr3:167,475,935; linked to E). Fleft = left (centromere) side of region F (chr3:167,475,865; linked to Hright). G = 8q del 2 breakpoint 2 (chr8:114,697,049; linked to Hleft). Hright = right (telomere) side of region H (chr8:111,368,737; linked to Fleft). Hleft = left (centromere) side of region H (chr8:111,368,715; linked to G). Iright = inverted reads at chr9:8,430,297 (linked to Jright). Ileft = inverted reads at chr9:8,430,297 (linked to Bleft). Jright = inverted reads at chr9:8,719,693 (linked to Iright). Jleft = chr9:8,719,701 (linked to Kright). Kright = chr3:157,869,331 (linked to Jleft). Kleft = chr3:157,869,330 (linked to Dright). Not to scale. C) Shown are the FISH results for chromosome 8 and chromosome 9. The green probe is to 14q32, the blue probe is to the centromere of chromosome 8, and the red probe is to 8q24. D) Shown is the updated schematic of chromosome 9 based on the karyotype, WGS, and FISH experiments. E) Shown is the updated schematic of chromosome 8 based on the karyotype, WGS, and FISH experiments. F) Shown are the FISH results for chromosome 11 and chromosome 13. The red probe is to 13q14, the green probe is to 13q34, and the yellow probe is to 11p15. G) Shown is the updated schematic of chromosome 11 based on the karyotype, WGS, and FISH experiments. H) Shown is the updated schematic of chromosome 13 based on the karyotype, WGS, and FISH experiments. Structural variation in this individual is likely due to chromothripsis.
Figure 3.
Figure 3.. 9P-ARCH Copy Number Variant Breakpoints Preferentially Localize to Two Late-Replicating Regions on 9p.
A) Chromosome bands on the p-arm of chromosome 9. B) Shown in orange are deletions and in blue duplications identified by WGS in 9P-ARCH, respectively. C) The previously published Repli-seq tracks are shown from ENCODE for GM12878 cells. These are consistent with replication timings in several other cell lines. We identified four late-replicating regions with highest signal intensity in the S4 phase or G2 phase of cell cycle. They are as follows: Late-Replicating Region 1 (LRR1, b38: chr9:7302516–14625487), Late-Replicating Region 2 (LRR2, b38: chr9:16012189–18667816), Late-Replicating Region 3 (LRR3, b38: chr9:22193299–26926755), and Late-Replicating Region 4 (LRR4, b38: chr9:27450126–32408022). D) and E) The majority of breakpoints identified in individuals with 9p deletion syndrome resided in LRR1 on 9p. This region contains the long gene (PTPRD) and is a region known to be an un-named fragile site and recurrent double-stranded break cluster region. Several of the other events have breakpoints in LRR2, which is the known human fragile site FRA9G. There are no breakpoints in the LRR3 or LRR4 that are known to be human fragile sites (FRA9C, FRA9A). The data in this figure support replication-based issues in LRR1 and LRR2 underlying the variation in 9p deletion syndromes. F) Shown is the percent of individuals with 9p deletion syndrome that have a breakpoint in one of the late replicating regions or in another part of 9p (orange) and the percent of genomic space that region takes up on 9p (gray). There is a significant excess of breakpoints in LRR1 (p = 3.0 × 10⁻⁸) and LRR2 (p = 3.8 × 10⁻³).
Figure 4:
Figure 4:. Prioritization of Genes in 9p Deletion Syndrome.
Show is the gene prioritization approach in this study to reduce the number of total 9p genes from 488 down to 24 genes of interest. This approach required comparison of our sequencing data with control sequencing data. Integration of other genomic dataset including our expanded denovo-db and detection of DNVs in WGS data from families with autism was necessary. Next, we developed a new statistical method called DiamondsDenovo and used this in parallel to other tools (fitDNM, denovolyzeR) to find genes and genomic regions with excess DNVs in individuals with relevant phenotypes. Finally, the list was narrowed down further to 24 genes with mean copy number less than 1.5 across individuals with 9p deletion syndrome sequenced in this study.
Figure 5:
Figure 5:. Spatial Expression in E13.5 Mouse Head of Genes Relevant to 9p Deletion Syndrome.
A) Histology showing sagittal section of E13.5 mouse head. B) Cell type assignment of cells in 10X Visium HD experiment generated in this study. C) through BB) show the expression of the gene listed below each image. To the left of each image is the scale bar and below the gene name is the mean copy number (CN) of the gene in individuals with 9p deletion syndrome. Note, we originally looked to assess the full set of 28 genes but two were not represented in the Visium HD probe set (Brd10, Zng1a). The most interesting genes are the 24 genes where the mean 9p CN is < 1.5 across the 9p deletion syndrome cohort.
Figure 6:
Figure 6:. Mitochondrial Genome Assessment Using EGP on Illumina Short-Read Whole-Genome Sequencing Data.
A) Maximum likelihood tree of mitochondrial genomes for all individuals sequenced in this study. The evolutionary history was inferred by using the Maximum Likelihood method and Tamura-Nei model. The tree with the highest log likelihood (−29132.73) is shown. Initial tree(s) for the heuristic search were obtained automatically by applying Neighbor-Join and BioNJ algorithms to a matrix of pairwise distances estimated using the Tamura-Nei model and then selecting the topology with superior log likelihood value. The tree is drawn to scale, with branch lengths measured in the number of substitutions per site. This analysis involved 98 nucleotide sequences. Codon positions included were 1st+2nd+3rd+Noncoding. There was a total of 16569 positions in the final dataset. Analyses were conducted in MEGA X. All familial relationships are confirmed in this analysis and individuals NA05067 and NA03226 are identified as the same individual. B) Mitochondrial genome copy number estimates specifically for individuals with WGS on blood-derived DNA. The data for the 1,801 controls is from 1,801 unaffected children that had previously been analyzed with EGP. There is a significantly higher mitochondrial genome copy number in individuals with 9p deletion syndrome (271.4 ± 58.7) than in controls (220.7 ± 32.4) (Mann Whitney U p = 3.9 × 10⁻¹⁵).
Figure 7.
Figure 7.. Copy Number Status of 24 Top Priority Genes in 9p Deletion Syndrome.
Each box represents the copy number across the entire gene (rows) for a given individual (columns). Orange means the individual has a deletion that gene and white means they do not. The genes are sorted by the most individuals containing a deletion in the gene to the least. Note that smaller deletions within these genes are not represented in these estimates.

References

    1. Sams E.I. et al. From karyotypes to precision genomics in 9p deletion and duplication syndromes. HGG Adv 3, 100081 (2022). - PMC - PubMed
    1. Starosta R.T. et al. Using a new analytic approach for genotyping and phenotyping chromosome 9p deletion syndrome. Eur J Hum Genet 32, 1095–1105 (2024). - PMC - PubMed
    1. Alfi O., Donnell G.N., Crandall B.F., Derencsenyi A. & Menon R. Deletion of the short arm of chromosome no.9 (46,9p-): a new deletion syndrome. Ann Genet 16, 17–22 (1973). - PubMed
    1. Alfi O.S., Donnell G.N., Allderdice P.W. & Derencsenyi A. The 9p- syndrome. Ann Genet 19, 11–6 (1976). - PubMed
    1. Banerjee I. et al. Refinement of the critical genomic region for congenital hyperinsulinism in the Chromosome 9p deletion syndrome. Wellcome Open Res 4, 149 (2019). - PMC - PubMed

Publication types