

Autonomous wave gliders as a tool to characterize delphinid habitats along the Florida Atlantic coast
- PMID: 40196306
- PMCID: PMC11974517
- DOI: 10.7717/peerj.19204
Autonomous wave gliders as a tool to characterize delphinid habitats along the Florida Atlantic coast
Abstract
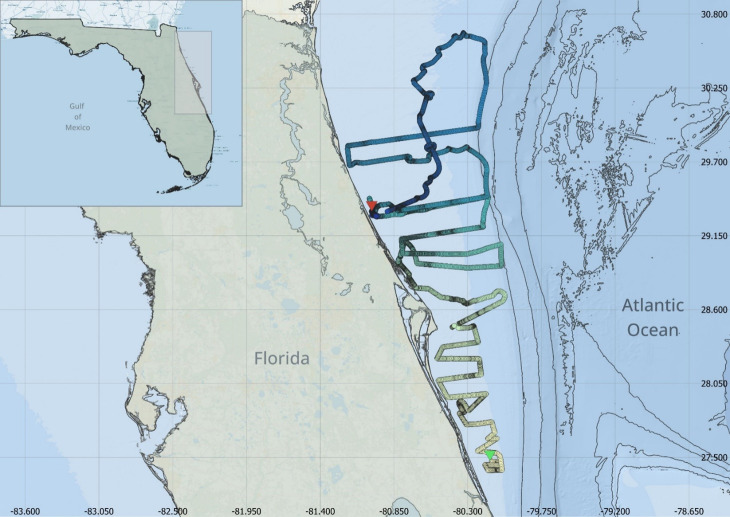
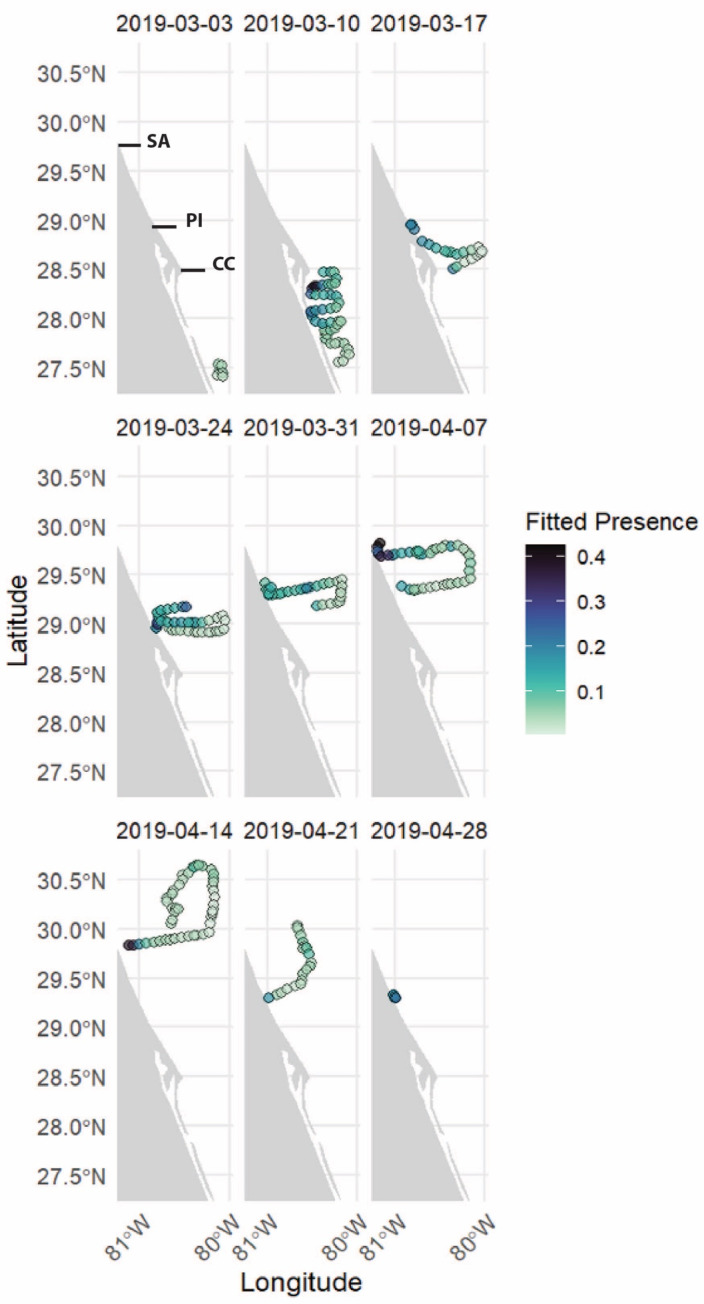
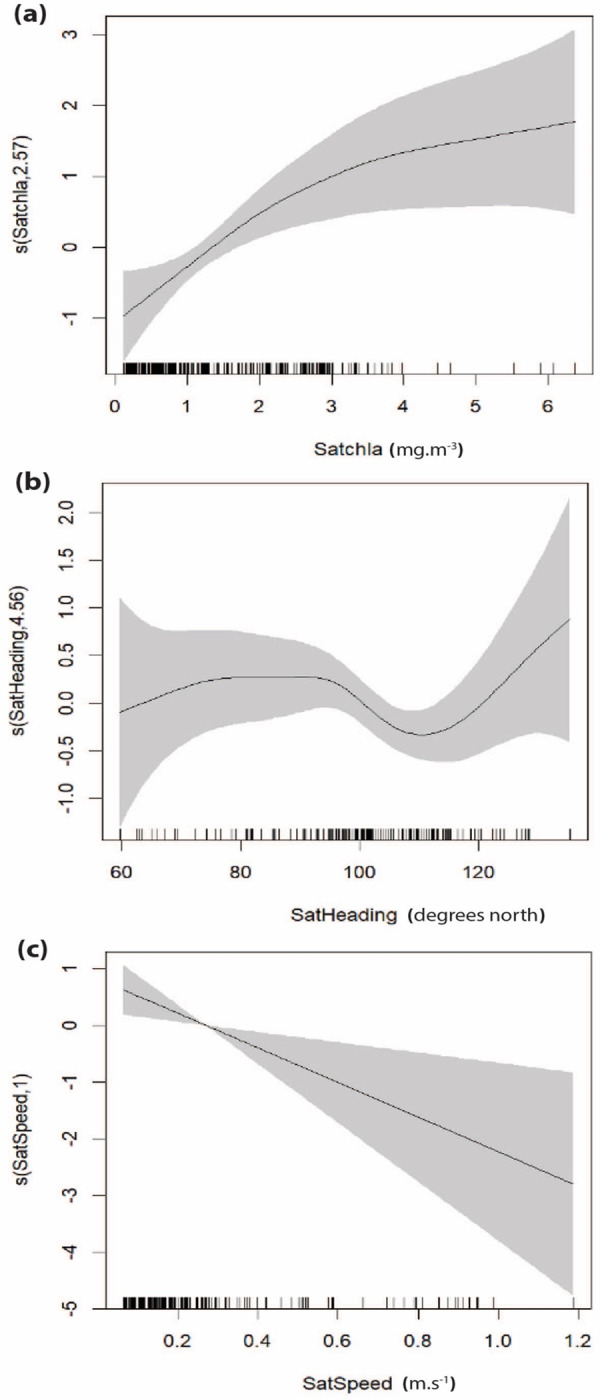
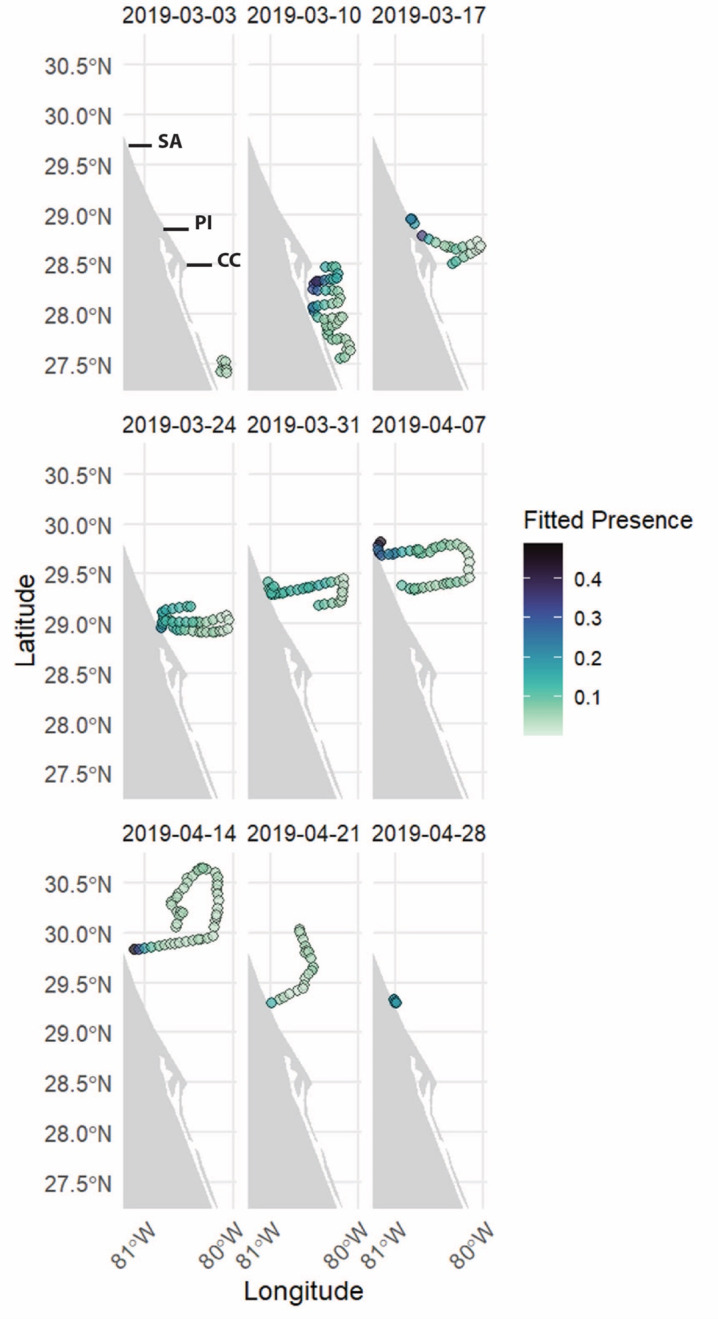
As climate change and anthropogenic activities continue to impact cetacean species, it becomes increasingly urgent to efficiently monitor cetacean populations. Continuing technological advances enable innovative research methodologies which broaden monitoring approaches. In our study, we utilized an autonomous wave glider equipped with acoustic and environmental sensors to assess delphinid species presence on the east Florida shelf and compared this approach with traditional marine mammal monitoring methods. Acoustic recordings were analyzed to detect delphinid presence along the glider track in conjunction with subsurface environmental variables such as temperature, salinity, current velocity, and chlorophyll-a concentration. Additionally, occurrences of soniferous fish and anthropogenic noise were also documented. These in-situ variables were incorporated into generalized additive models (GAMs) to identify predictors of delphinid presence. The top-performing GAM found that location, sound pressure level (SPL), temperature, and chlorophyll-a concentration explained 50.8% of the deviance in the dataset. The use of satellite environmental variables with the absence of acoustic variables found that location, derived current speed and heading, and chlorophyll-a explained 44.8% of deviance in the dataset. Our research reveals the explanatory power of acoustic variables, measurable with autonomous platforms such as wave gliders, in delphinid presence drivers and habitat characterization.
Keywords: Autonomous gliders; Delphinids; Generalized additive models; Habitat characterization; Marine mammal monitoring; Passive acoustic monitoring.
©2025 Carvalho et al.
Conflict of interest statement
The authors declare there are no competing interests.
Figures


Similar articles
-
Autonomous Surface and Underwater Vehicles as Effective Ecosystem Monitoring and Research Platforms in the Arctic-The Glider Project.Sensors (Basel). 2021 Oct 12;21(20):6752. doi: 10.3390/s21206752. Sensors (Basel). 2021. PMID: 34695965 Free PMC article.
-
Acoustic fish community in the Madeira Archipelago (North Atlantic Ocean): Characterization of sound diversity and daily patterns.Mar Environ Res. 2024 Jul;199:106600. doi: 10.1016/j.marenvres.2024.106600. Epub 2024 Jun 8. Mar Environ Res. 2024. PMID: 38875901
-
Ocean sound levels in the northeast Pacific recorded from an autonomous underwater glider.PLoS One. 2019 Nov 20;14(11):e0225325. doi: 10.1371/journal.pone.0225325. eCollection 2019. PLoS One. 2019. PMID: 31747444 Free PMC article.
-
Marine environmental monitoring with unmanned vehicle platforms: Present applications and future prospects.Sci Total Environ. 2023 Feb 1;858(Pt 1):159741. doi: 10.1016/j.scitotenv.2022.159741. Epub 2022 Oct 27. Sci Total Environ. 2023. PMID: 36349622 Review.
-
Marine harmful algal blooms (HABs) in the United States: History, current status and future trends.Harmful Algae. 2021 Feb;102:101975. doi: 10.1016/j.hal.2021.101975. Epub 2021 Mar 3. Harmful Algae. 2021. PMID: 33875183 Free PMC article. Review.
References
-
- Aniceto AS, Pedersen G, Primicerio R, Biuw M, Lindstrøm U, Camus L. Arctic marine data collection using oceanic gliders: providing ecological context to cetacean vocalizations. Frontiers in Marine Science. 2020;7:585754. doi: 10.3389/fmars.2020.585754. - DOI
-
- Barros NB, Wells RS. Prey and feeding patterns of resident Bottlenose Dolphins (Tursiops truncatus) in Sarasota Bay, Florida. Journal of Mammalogy. 1998;79:1045–1059. doi: 10.2307/1383114. - DOI
-
- Bas AA, Christiansen F, Öztürk B, Öztürk AA, Erdoǧan MA, Watson LJ. Marine vessels alter the behaviour of bottlenose dolphins Tursiops truncatus in the Istanbul Strait, Turkey. Endangered Species Research. 2017;34:1–14. doi: 10.3354/esr00836. - DOI
-
- Best BD, Halpin PN, Read AJ, Fujioka E, Good CP, LaBrecque EA, Schick RS, Roberts JJ, Hazen LJ, Qian SS, Palka DL, Garrison LP, McLellan WA. Online cetacean habitat modeling system for the US east coast and Gulf of Mexico. Endangered Species Research. 2012;18:1–15. doi: 10.3354/esr00430. - DOI
MeSH terms
Substances
LinkOut - more resources
Full Text Sources
Research Materials
