[Preprint]. 2025 Mar 27:2025.03.24.644912.
doi: 10.1101/2025.03.24.644912.

Temporal evolution of hemodynamics in murine arteriovenous fistula: a micro-CT based computational fluid dynamics study

Affiliations

Temporal evolution of hemodynamics in murine arteriovenous fistula: a micro-CT based computational fluid dynamics study

Lianxia Li et al. bioRxiv. .

Update in

Abstract

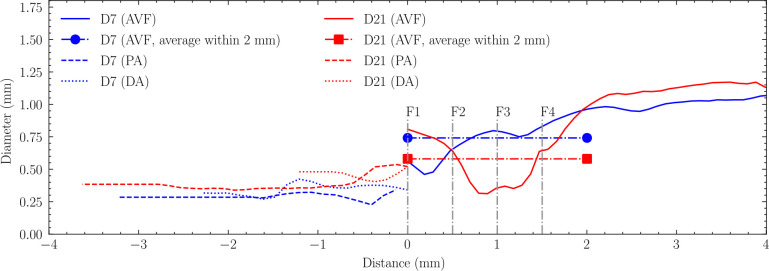
In this study, we investigated the hemodynamic characteristics of arteriovenous fistulae (AVF) in murine models using micro-CT based computational fluid dynamics (CFD). By combining high-resolution micro-CT imaging with ultrasound flow measurements, our methodology offers a cost-effective and efficient alternative to traditional MRI-based approaches. CFD simulations performed at 7 and 21 days post-surgery revealed significant temporal changes in both geometry and hemodynamics. Geometric analysis showed that: the proximal artery diameter increased from 0.29 mm to 0.38 mm, while the initial 2 mm fistula segment showed a 21.6% decrease (0.74 mm to 0.58 mm). Blood flow through the AVF nearly doubled from 1.33 mL/min to 2.57 mL/min. Time-averaged wall shear stress (TAWSS) peak values increased from 142 Pa (day 7) within the proximal artery to 200 Pa (day 21), in the stenotic region. The oscillatory shear index (OSI) showed marked elevation at the anastomosis (increasing from 0.22 to 0.48), indicating disturbed flow development. An inverse relationship between TAWSS and OSI was identified consistent with previous studies. Our methodology demonstrates the capability to analyze relationships between early hemodynamics and subsequent geometric changes. This approach could enable identification of regions susceptible to stenosis development and monitoring of AVF maturation, which could ultimately lead to quantitative metrics to evaluate surgical outcomes and early therapeutic interventions.

Keywords: Arteriovenous fistula; Cross-temporal correlation; Hemodynamics; Micro-CT based CFD; Murine model; Oscillatory shear index; Wall shear stress.


Figures

Fig 1.
Fig 1.
AVF creation using end-to-side anastomosis between jugular vein and carotid artery in murine model. White arrow shows direction of venous outflow.
Fig 2.
Fig 2.
(a) CT images and volume rending for day 7 in Slicer 3d [33]; three-dimensional reconstructions of murine arteriovenous fistula (AVF) models showing vascular architecture at (b) day 7 and (c) day 21 post-surgery. Color coding represents distinct vessel segments: red indicates the carotid artery (with the proximal segment at bottom and distal segment at top), yellow highlights the AVF region (4 mm of length), and blue shows the main venous drainage with its characteristic ballooning of the vein starting 4 mm from the anastomosis.
Fig 3.
Fig 3.
Computational domain, boundary conditions, and mesh configuration for the murine AVF model (day 7 shown). Boundary conditions are specified as follows: (1) velocity-based inlet conditions at both proximal and distal carotid artery ends, derived from ultrasound Doppler waveforms; (2) no-slip conditions at all vessel walls; and (3) pressure boundary condition at the venous outlet. The computational domain is discretized using tetrahedral meshes with five boundary layers near the walls. The inset shows a detailed view of the mesh structure at the arteriovenous junction.
Fig 4.
Fig 4.
Lumen diameter profiles along the vascular segments at day 7 (D7) and day 21 (D21). The x-axis represents the distance from the anastomosis, with negative values indicating upstream segments (proximal artery [PA] and distal artery [DA]) and positive values indicating downstream segments (arteriovenous fistula [AVF]). The average AVF diameter is measured within the first 2mm of the fistula. Cross-sections F1-F4, spaced 0.5mm apart, indicate locations analyzed for hemodynamics in results.
Fig 5.
Fig 5.
Flow patterns within the AVF at peak systole for day 7 (a) and day 21 (b) models. Streamlines colored by velocity magnitude show the three-dimensional flow trajectories. Cross-sectional velocity distributions at representative locations demonstrate the spatial evolution of the flow field. The color scale represents velocity magnitude in mm/s. Cross-sectional dimensions are not to scale.
Fig 6.
Fig 6.
Cross-sectional average velocity and pressure along the vessel centerline at peak diastole for day 7 and day 21 models. The plots show velocity (red) and pressure (blue) distributions relative to distance from the anastomosis. Both models exhibit characteristic features: a sharp velocity increase preceding the stenosis followed by deceleration, with large velocities occurring within 1 mm downstream of the anastomosis. A corresponding abrupt pressure drop is observed immediately before the stenotic region. The pressure drop completes (99%) within 1.5mm downstream of the anastomosis on day 21, while it only occurs 50% over the same distance on day 7.
Fig 7.
Fig 7.
Cross-sectional maximum and average distributions of TAWSS along the centerline for (a) day 7 and (b) day 21. The two horizontal lines represent the average values across the first 4mm AVF. For day 7, peak TAWSS is localized within 0.5 mm downstream from the anastomosis, with an average value of 3 Pa across the 4 mm fistula region. By day 21, peak TAWSS shifts to 1.2 mm downstream from the anastomosis, with the average value increasing fourfold to 13 Pa across the 4 mm fistula region.
Fig 8.
Fig 8.
Time-averaged wall shear stress (TAWSS) distributions of (a) day 7 and (b) day 21 models. Each panel shows three-dimensional TAWSS colormaps along the vessel surfaces and representative cross-sectional (F1 to F4) distributions showing circumferential variation of TAWSS at key locations (anastomosis, stenosis, and AVF). TAWSS exhibits pronounced spatial heterogeneity, with peak values localized at the stenotic region. A significant temporal increase in TAWSS magnitude is observed from day 7 to day 21, particularly in regions of geometric constriction. Color scale represents TAWSS in Pa. Points A and B (indicated by arrows) show locations of maximum TAWSS values: 142 Pa and 37 Pa on day 7, and 134 Pa and 200 Pa on day 21, respectively. Cross-sectional dimensions are not to scale.
Fig 9.
Fig 9.
Cross-sectional maximum and average distributions of OSI along the centerline for (a) day 7 and (b) day 21. The two horizontal lines represent the average values across the first 4mm AVF. For day 7, peak OSI occurs within 1.0 mm downstream from the anastomosis, with an average value of 0.0025 across the 4 mm fistula region. By day 21, peak OSI extends from 1.0 to 2.5 mm downstream from the anastomosis, with the average value increasing significantly to 0.016 across the 4 mm fistula region.
Fig 10.
Fig 10.
Oscillatory Shear Index (OSI) distributions of (a) day 7 and (b) day 21 models. Each panel shows three-dimensional OSI colormaps along the vessel surfaces and representative cross-sectional distributions showing circumferential variation of OSI at key locations (anastomosis, stenosis, and AVF). High OSI regions are predominantly localized at the anastomosis and downstream of the stenosis. OSI demonstrates circumferential heterogeneity, with elevated values corresponding to regions of flow separation. An obvious temporal increase in OSI magnitude is observed from day 7 to day 21. Color scale represents dimensionless OSI values from 0 to 0.1. Points A and B (indicated by arrows) show locations of maximum OSI values: 0.22 and 0.17 on day 7, increasing to 0.48 and 0.26 on day 21, respectively. Cross-sectional dimensions are not to scale.
Fig 11.
Fig 11.
Vortical structures visualized using Q-criterion for (a) day 7 and (b) day 21 models. While vortical structures predominantly develop near vessel walls, a distinct vortex core (marked by circle) forms within the AVF vein lumen. Temporal comparison reveals increased vortical intensity on day 21 compared to day 7, particularly pronounced in stenotic regions. Although relatively small in magnitude, vortical structures are also observed to develop within the main vein. Color scale represents Q-criterion magnitude (s−2), with positive values indicating regions where rotation dominates strain.
Fig 12.
Fig 12.
Same-day correlations between TAWSS and AVF lumen diameter. A strong nonlinear inverse relationship with diameter on both days was observed.

References

    1. Manov JJ, Mohan PP, Vazquez-Padron RJTjova. Arteriovenous fistulas for hemodialysis: Brief review and current problems. 2022;23(5):839–46. - PubMed
    1. Miller L, Clark E, Dipchand C, Hiremath S, Kappel J, Kiaii M, et al. Hemodialysis tunneled catheter-related infections. Can J Kidney Health Dis 3. 2016:1–11. - PMC - PubMed
    1. Lok CE, Huber TS, Orchanian-Cheff A, Rajan DKJJ. Arteriovenous access for hemodialysis: a review. JAMA 2024. - PubMed
    1. Meng L, Ng JJ, Choong AMTL, Dharmaraj RB, Menon R, Wong JCL, et al. , editors. Effectiveness of a native vein arteriovenous fistula tracking system. Seminars in Dialysis; 2024: Wiley Online Library. - PubMed
    1. Al-Jaishi AA, Oliver MJ, Thomas SM, Lok CE, Zhang JC, Garg AX, et al. Patency rates of the arteriovenous fistula for hemodialysis: a systematic review and meta-analysis. American Journal of Kidney Diseases. 2014;63(3):464–78. - PubMed

Publication types

LinkOut - more resources