[Preprint]. 2025 Mar 29:2025.03.26.645495.
doi: 10.1101/2025.03.26.645495.

Androgen Deprivation-Induced TET2 Activation Fuels Prostate Cancer Progression via Epigenetic Priming and Slow-Cycling Cancer Cells

Affiliations

Androgen Deprivation-Induced TET2 Activation Fuels Prostate Cancer Progression via Epigenetic Priming and Slow-Cycling Cancer Cells

Lin Li et al. bioRxiv. .

Abstract

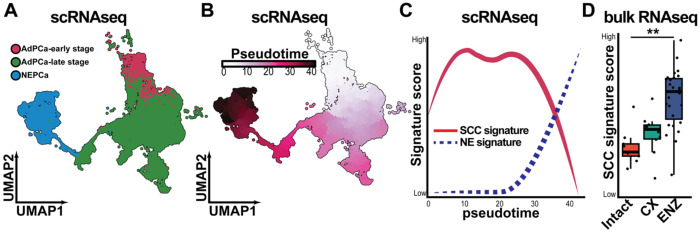
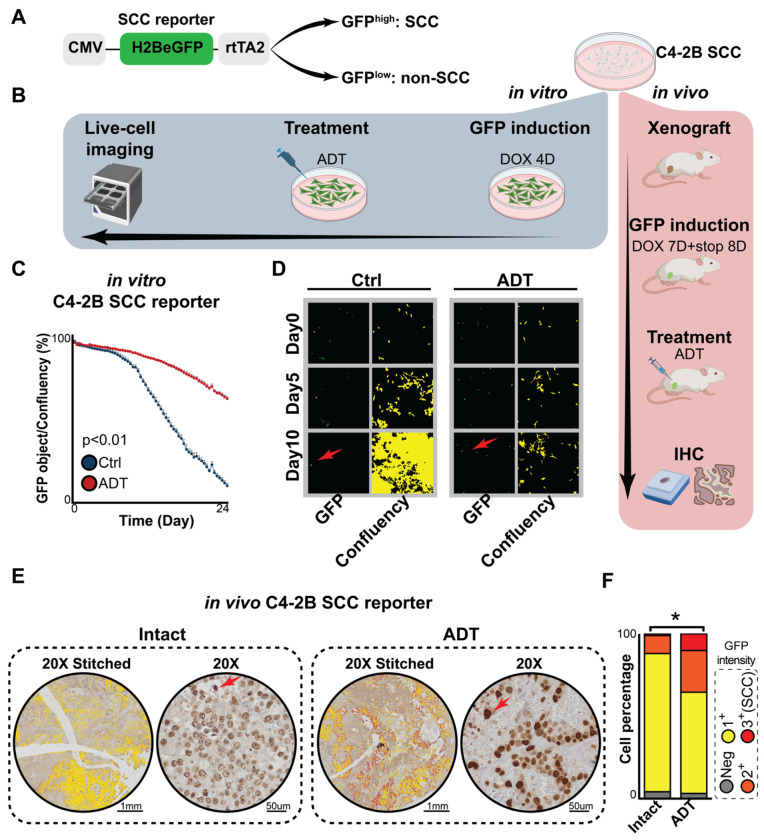
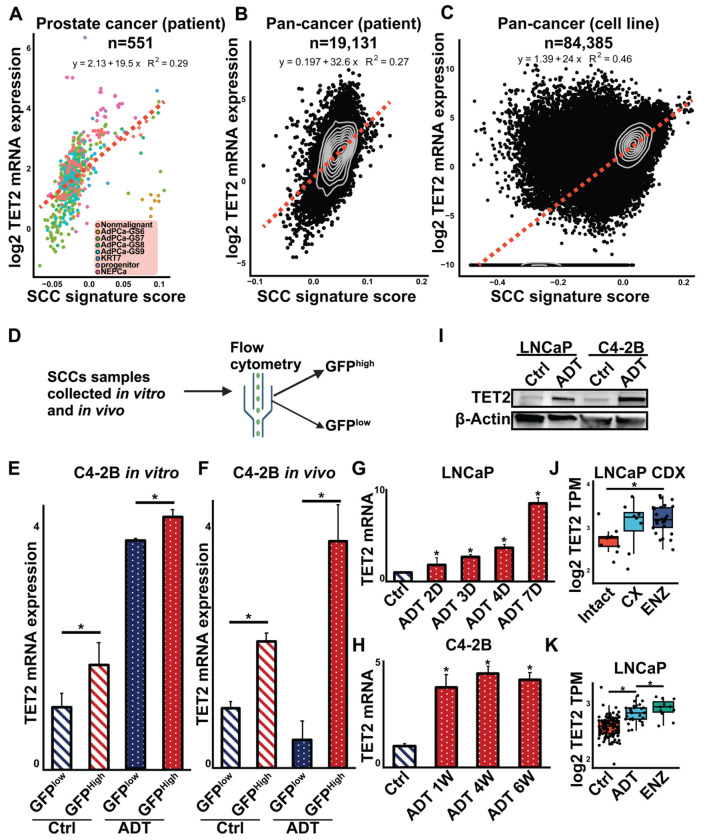
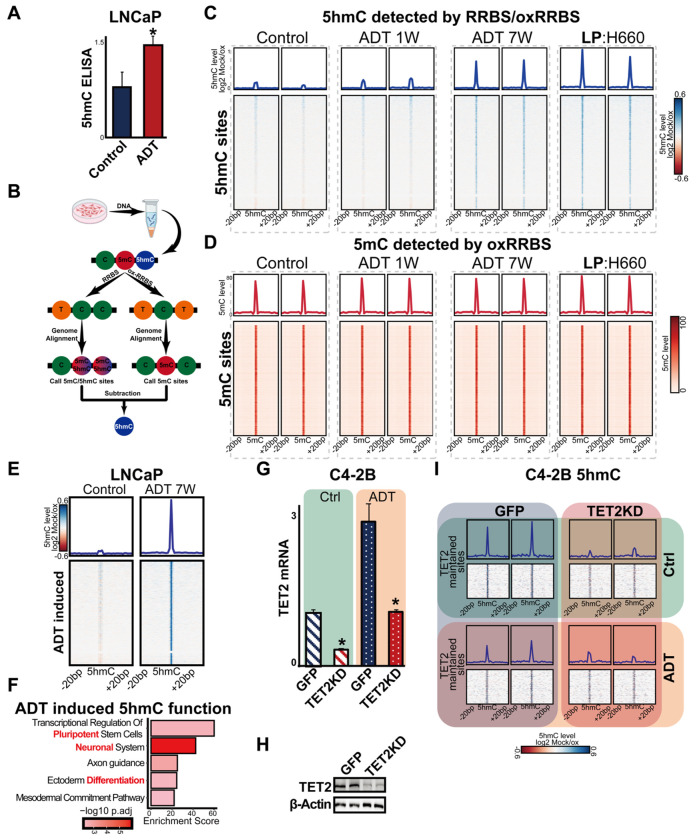
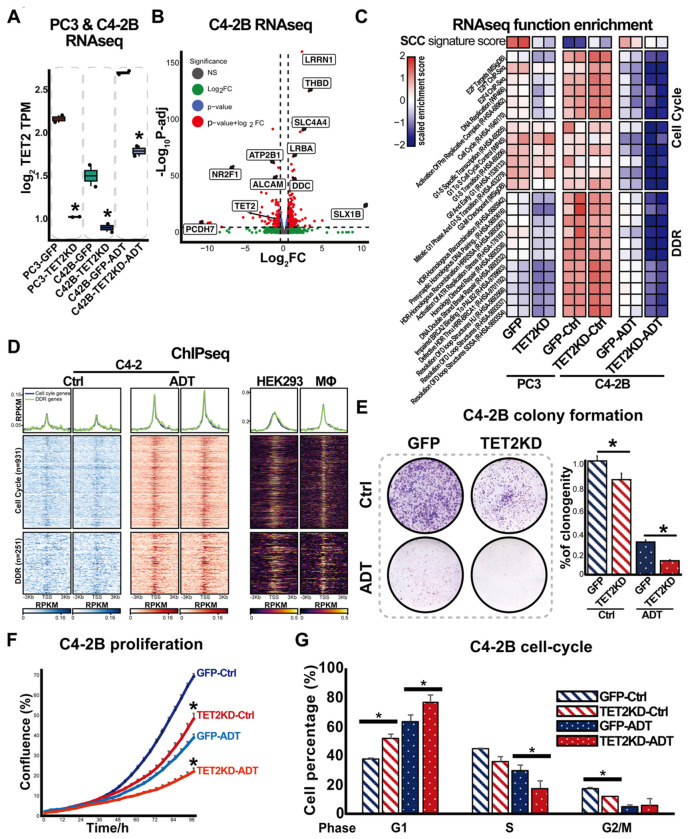
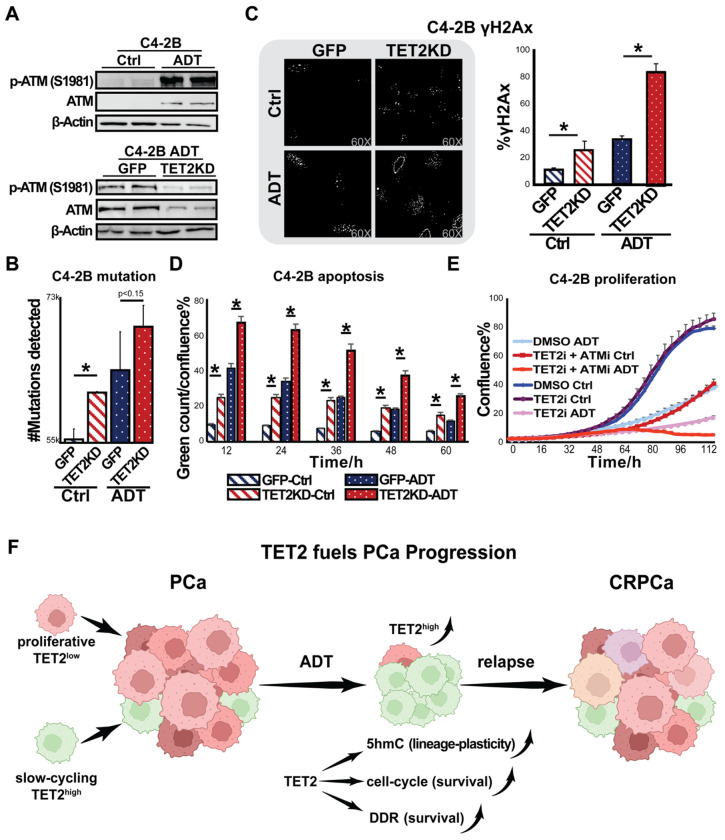
Advanced prostate cancer (PCa) frequently develops resistance to androgen deprivation therapy through various mechanisms including lineage plasticity. Slow-cycling cells (SCCs) have emerged as key players in adaptive responses to therapy, yet their role in PCa remains unclear. Through in silico analysis of single-cell RNA sequencing (scRNA-seq) data, we discovered that SCCs are enriched during pivotal stages of PCa progression, including the transition from androgen-dependent to castration-resistant states and the emergence of neuroendocrine PCa (NEPC). Using a tetracycline-inducible H2BeGFP reporter system, we confirmed SCC enrichment following androgen deprivation in both in vitro and in vivo models. Furthermore, we identified TET2 as a key regulator of SCCs, with its expression upregulated by androgen deprivation and positively correlated with SCC signature scores in PCa. Genome-wide 5-hydroxymethylcytosine (5hmC) profiling revealed increased hydroxymethylation after androgen deprivation, while TET2 knockdown reduced 5hmC levels at specific loci. Functional studies demonstrated that TET2 governs SCC maintenance, cell cycle progression, and DNA damage repair. Targeting TET2, either alone or in combination with an ATM inhibitor, significantly suppressed tumor growth, highlighting TET2 as a promising therapeutic target. Our study provides the first single-nucleotide resolution map of 5hmC dynamics in PCa, identifies a cell state driving epigenetic rewiring, and underscores the transformative potential of novel therapeutic strategies for advanced PCa.


Figures

Figure 1.
Figure 1.. The SCC score is associated with PCa progression.
(A) UMAP plot displaying distinct PCa cell populations within murine prostatic tumors based on scRNA-seq data from the MoPSA dataset. Pink: early-stage AdPCa; green: castrate-resistant AdPCa; blue: NEPCa. (B) Pseudotime trajectory predicting the predicted progression from early-stage AdPCa to castrate-resistant AdPCa and ultimately to NEPCa. The trajectory was reconstructed using UMAP embedding and the SimplePPT algorithm. Pseudotime values, calculated as the shortest path distances from a biologically defined root cell, represent relative progression rather than absolute time. (C) SCC score along the pseudotime trajectory of PCa progression. (D) SCC scores calculated from publicly available RNA-seq data (GSE211856) of LNCaP xenografts in intact mice, castrated (CX), and enzalutamide-treated (ENZ) mice. Student’s t-test, p < 0.05.
Figure 2.
Figure 2.. SCCs are enriched following androgen deprivation in PCa cells.
(A) Schematic of the construct used for generating C4-2B SCC cells. The H2B-eGFP fusion gene expression is regulated by the reverse tetracycline transactivator (rtTA2) and activated by doxycycline (DOX). After DOX withdrawal, cells with high GFP intensity were considered as SCCs, while cells with low GFP intensity were non-SCCs Figure adapted from Addgene. (B) Experimental workflow for in vitro and in vivo SCC studies. In vitro, cells were treated with DOX for 4 days, followed by 10 days culturing with or without ADT. In vivo, xenografted tumors were labeled with DOX for 7 days. 8 days after DOX withdrawal, mice were either left untreated (Intact) or subjected to castration and ENZ (10 mg/kg) treatment (ADT) for 7 days. Workflow created using BioRender. (C) Quantification of GFP-positive cells under androgen-deprivation conditions compared to controls over a 10-day culture period, n=6. Student’s t-test, p < 0.01. (D) Live-cell imaging of GFP expression and confluency masks in control (Ctrl) and ADT groups at day 0, day 5, and day 10. Arrows indicate SCCs. (E) IHC staining of GFP in xenograft tumors. Upper panels show stitched images (20× magnification), and lower panels provide magnified views. Arrows highlight SCCs. Scale bars are indicated under the images. (F) Quantification of IHC results using QuPath. Cancer cells were categorized by GFP intensity into four groups: GFP−, GFP 1+ (0-0.2 raw pixel intensity, yellow color), GFP 2+ (0.2-0.4 raw pixel intensity, orange color), and GFP 3+ (0.4-0.8 raw pixel intensity, red color). Similar trends were observed in repeated experiments (n=3),two-way ANOVA, p < 0.05.
Figure 3.
Figure 3.. TET2 expression is higher in PCa SCCs and following androgen deprivation.
(A) Correlation of TET2 expression with SCC score in PCa patient cohorts, including non-malignant tissues, Gleason scores 6 - 9, double-negative PCa (DNPCa), and NEPCa. (B) Correlation of TET2 expression with SCC score across TCGA pan-cancer patient cohorts. (C) Correlation of TET2 expression with SCC score in pan-cancer cell lines. (D) Workflow for isolating SCCs from non-SCCs using FACS to sort GFPhigh (SCCs) and GFPlow (non-SCCs) cells. (E) RT-qPCR analysis of TET2 expression in GFPhigh and GFPlow cells in vitro cultured with or without ADT. Student’s t-test, p < 0.05. (F) RT-qPCR analysis of TET2 expression in GFPhigh and GFPlow cells in vivo xenograft from intact or castration + ENZ (ADT) mice. Student’s t-test, p < 0.05. (G) RT-qPCR analysis of TET2 expression in LNCaP cells cultured with or without ADT for 2, 3, 4, and 7 days, n=3. (H) RT-qPCR analysis of TET2 expression in C4-2B cells cultured with or without ADT for 1, 4 and 6 weeks, n=3. (I) Western blot analysis of TET2 protein levels in LNCaP and C4-2B cells with or without androgen deprivation. (J) The mRNA expression of TET2 in LNCaP xenografts in intact mice, castrated (CX), and enzalutamide-treated (ENZ) mice, data generated using publicly available RNA-seq data (GSE211856). Student’s t-test, p < 0.05. (K) Bioinformatic analysis of mRNA expression of TET2 in LNCaP cell cultured in full serum media, CS or ENZ conditions. Student’ t-test, p < 0.05.
Figure 4.
Figure 4.. oxRRBS analysis on PCa cells treated with or without androgen deprivation.
(A) 5hmC levels in LNCaP cells cultured in full serum media (Control) or CS (ADT) for 3 weeks assessed via ELISA, n=3. Student’s t-test, p < 0.05. (B) Workflow for RRBS and oxRRBS analysis. Control LNCaP cells and those cultured in full serum media (Control) or CS media (ADT) for 1 week, 7 weeks, and H660 cells were analyzed using oxRRBS assays, n=2. (C) Heatmap showing enriched regions for 5hmC across experimental conditions. (D) Heatmap showing enriched regions for 5mC in the same conditions as (C). (E) Heatmap showing differentially hydroxymethylated regions in LNCaP cells cultured with or without androgen depletion. (F) Enriched signaling pathways in differentially hydroxymethylated regions, highlighting associations with pluripotency, neuronal function, and ectoderm differentiation. TET2 knockdown efficiency was assessed by RT-qPCR (G) and western blot (H) in C4-2B cells. Student t-test, p < 0.05. (I) Heatmap showing 5hmC sites in C4-2B GFP or TET2KD cells cultured with or without ADT.
Figure 5.
Figure 5.. TET2 regulates the cell cycle in PCa cells.
(A) TET2 mRNA levels in PC3 and C4-2B cells following TET2 knockdown, as determined by RNA-seq analysis. (B) Volcano plot showing differentially expressed (DE) genes in C4-2B control and TET2KD cells following androgen depletion. The fold-change and p-value were calculated between the two groups. All genes were shown, with only the most significant ones annotated with gene symbols. (C) Single-sample gene set enrichment analysis (ssGSEA) identifying signaling pathways affected by TET2 knockdown in PC3 and C4-2B cells. (D) Heatmap showing TET2 CHIPseq peaks in DNA damage response (DDR)- and cell cycle-related genes in C4-2 cells, under control and androgen deprivations. HEK293 and macrophage (Mϕ) were used as positive controls. (E) Left: colony formation assay in C4-2B GFP or TET2KD cells cultured with or without ADT, n=6. Right: quantification of colony formation. Student t-test, p < 0.05. (F) Cell proliferation assay in C4-2B GFP or TET2KD cells cultured in full serum media (Ctrl) or CS + 20μM ENZ (ADT), n=6. measured using IncuCyte S3. (G) Cell cycle analysis of C4-2B GFP or TET2KD cells cultured with or without ADT, n=2. Student t-test, * p < 0.05.
Figure 6.
Figure 6.. Knockdown of TET2 induces DDR and reduces cell proliferation.
(A) Upper panel: Expression of ATM and p-ATM (S1981) in C4-2B cells cultured with or without ADT. Lower panel: Expression of ATM and p-ATM (S1981) in C4-2B GFP or TET2KD cells cultured with or without ADT. (B) Mutations analysis of RNAseq data from C4-2B GFP or TET2KD cells cultured with or without ADT, Student t-test, * p <0 .05. (C) Left: Immunofluorescence staining of phospho-H2Ax (γH2AX) in C4-2B of C4-2B GFP or TET2KD cells cultured with or without ADT. Right: Quantification of γH2AX foci per cell (> 25 cells per group). Student t-test, p < 0.05. (D) Apoptosis analysis in C4-2B cells with or without TET2KD (Ctrl and TET2KD, respectively) cultured with or without ADT, n=6. Annexin V staining was used to detect apoptotic cells, followed by live-cell imaging for up to 60 hours. Apoptotic cells were quantified based on Annexin V- positive signals. Student’s t-test, p < 0.05. (E) Cell proliferation assay assessing the effects of TET2 and ATM inhibitors on PCa cell proliferation. C4-2B cells were cultured with or without ADT. treated with DMSO, Bobcat339 (TET2i, 10μM), AZD0156 (ATMi, 0.5μM), or a combination of both inhibitors, n=6. Live-cell imaging was conducted using Incucyte S3. (F) Proposed model depicting the role of TET2 in regulating PCa treatment resistance. The figure was generated using Biorender.

Similar articles

References

    1. Debes J. D. & Tindall D. J. Mechanisms of androgen-refractory prostate cancer. New England Journal of Medicine 351, 1488–1490 (2004). - PubMed
    1. Li X. & Mu P. Restoring our ubiquitination machinery to overcome resistance in cancer therapy. Oncoscience 11, 43 (2024). - PMC - PubMed
    1. Li X. & Mu P. The critical interplay of CAF plasticity and resistance in prostate cancer. Cancer research 83, 2990–2992 (2023). - PubMed
    1. Blatt E. B. et al. Overcoming oncogene addiction in breast and prostate cancers: a comparative mechanistic overview. Endocrine-related cancer 28, R31–R46 (2021). - PMC - PubMed
    1. Rodriguez Tirado C. et al. UBE2J1 is the E2 ubiquitin-conjugating enzyme regulating androgen receptor degradation and antiandrogen resistance. Oncogene 43, 265–280 (2024). - PMC - PubMed

Publication types