[Preprint]. 2025 Mar 25:2025.03.24.645038.
doi: 10.1101/2025.03.24.645038.

ATG2A engages Rab1a and ARFGAP1 positive membranes during autophagosome biogenesis

Affiliations

ATG2A engages Rab1a and ARFGAP1 positive membranes during autophagosome biogenesis

Devin M Fuller et al. bioRxiv. .

Abstract

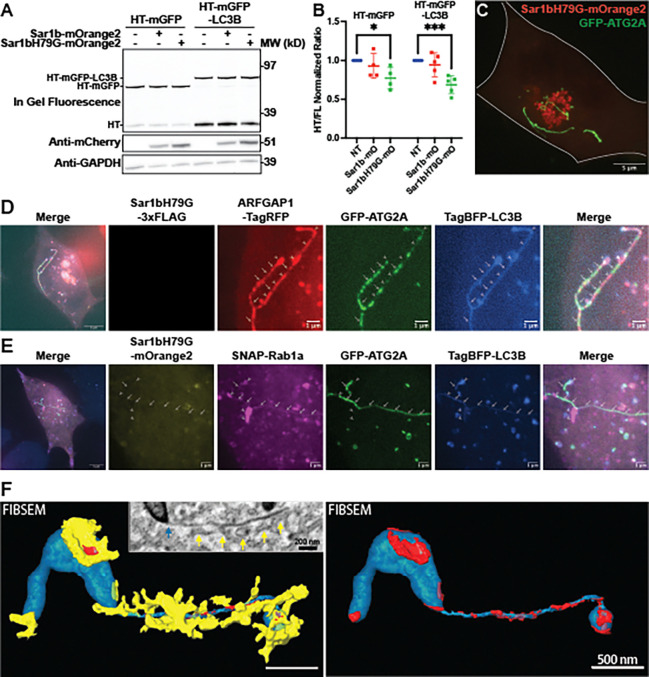
Autophagosomes form from seed membranes that expand through bulk-lipid transport via the bridge-like lipid transporter ATG2. The origins of the seed membranes and their relationship to the lipid transport machinery are poorly understood. Using proximity labeling and a variety of fluorescence microscopy techniques, we show that ATG2A localizes to extra-Golgi ARFGAP1 puncta during autophagosome biogenesis. ARFGAP1 itself is dispensable during macroautophagy, but among other proteins associating to these membranes, we find that Rab1 is essential. ATG2A co-immunoprecipitates strongly with Rab1a, and siRNA-mediated depletion of Rab1 blocks autophagy downstream of LC3B lipidation, similar to ATG2A depletion. Further, when either autophagosome formation or the early secretory pathway is perturbed, ARFGAP1 and Rab1a accumulate at ectopic locations with autophagic machinery. Our results suggest that ATG2A engages a Rab1a complex on select early secretory membranes at an early stage in autophagosome biogenesis.


Conflict of interest statement

Competing Interest Statement: FS and JB filed patent applications with the U.S. patent office covering FLASH-PAINT. JB has licensed IP to Bruker Corp. and Hamamatsu Photonics. JB is a founder of panluminate, Inc.

Figures

Figure 1.
Figure 1.. ATG2A is proximal to ARFGAP1 positive membranes.
(A) Proximity labeling of HEK293 ATG2 DKO cells stably expressing APEX2-GFP-ATG2A was performed as previously described. Three biological replicates were averaged and plotted as the log2 ratio between the full labeling reaction in complete media over cells that were not treated with hydrogen peroxide on the x axis, and −log10 of the p-value on the y axis. The red line demonstrates the p-value cutoff of 0.05. The proteomics revealed an enrichment of autophagy (labeled in green) and early secretory proteins (COPII/ER Exit Site proteins are labeled in orange, ARFGAP1 is labeled in red). (B) Strategy to identify phagophores by live cell imaging. Phagophores are defined as sites where both GFP-ATG2A and TagBFP-LC3B co-localize. (C-D) Live cell imaging of ATG2 DKO cells stably expressing GFP-ATG2A and TagBFP-LC3B and transfected with mRuby-Sec23A or RFP-Sec23IP/p125a or ARFGAP1-TagRFP. The cells were starved for 2–4 hours prior to imaging. The fraction of phagophores (white arrows) that colocalized with the third fluorescent protein (transfected gene) was quantified and plotted in (D). Statistical significance was assessed by one way ANOVA. *, adjusted P value <0.05. **, adjusted P value <0.01. ***, adjusted P value <0.001. ****, adjusted P value <0.0001. Data from three biological replicates were pooled for each condition. Maximum intensity projections of confocal images. (E) Global organelle profiling data from https://organelles.sf.czbiohub.org. Whole organelle profiles were established by pulling down endogenously tagged proteins and performing quantitative proteomics. The enrichment value for each protein were calculated by taking the difference in median log2 LFQ values between the replicates and the null distribution.
Figure 2.
Figure 2.. Autophagic flux depends upon Rab1 but not ARFGAP1.
(A-B) In gel fluorescence image (top panel) and immunoblots demonstrating that siRNA KD of Rab1 inhibits autophagic flux. In gel fluorescence reveals HaloTag7s moeity bound to the TMR ligand. Indicated bands are full length (FL) HT-mGFP-LC3B protein and HaloTag7 after cleavage (HT) in the lysosome. The ratio between FL and HT demonstrates autophagic flux, quantified in (B). Statistical significance was assessed by one way ANOVA. *, adjusted P value <0.05. **, adjusted P value <0.01. ***, adjusted P value <0.001. ****, adjusted P value <0.0001. Data from three biological replicates were collected for each condition. (C-D) Immunoblot of lysates from three biological replicates demonstrating that siRNA KD of Rab1 results in an accumulation of LC3B-II. The band intensity of LC3B-II was normalized against the intensity of GAPDH for each lane. To normalize each replicate, each individual value was divided by value of the non-transfected sample. Statistical significance was assessed by one way ANOVA. *, adjusted P value <0.05. **, adjusted P value <0.01. ***, adjusted P value <0.001. ****, adjusted P value <0.0001. (E-F) Immunoblot showing CoIP between GFP-Rab1a and 3xFLAG-ATG2A compared to the same reaction with other GFP-tagged early secretory proteins. The cells were incubated with either complete media or EBSS for four hours prior to harvesting. For the CoIP, ~3 mg of cell lysate was used per condition (slight deviations in total amount between replicates, but not between lanes). To quantify the results, the intensity of the 3xFLAG-ATG2A IP signal was ratioed against the input signal. To normalize each replicate, each individual value was divided by the average of the replicate. Statistical significance was assessed by two way ANOVA. *, adjusted P value <0.05. **, adjusted P value <0.01. ***, adjusted P value <0.001. ****, adjusted P value <0.0001. The media was not a significant source of variation (p = 0.3535).
Figure 3.
Figure 3.. ATG2A, LC3B, ARFGAP1, and Rab1a localize to tubules following disruption of the early secretory pathway.
(A-B) In gel fluorescence image (top panel) and immunoblots demonstrating that Sar1bH79G-mOrange2 (mO) overexpression negatively affects autophagic flux. The ratio between the FL and the free HT represents the autophagic flux in each condition (as in Fig. 2 A/B) and is plotted in (B). Statistical significance was assessed by two way ANOVA. *, adjusted P value <0.05. **, adjusted P value <0.01. ***, adjusted P value <0.001. ****, adjusted P value <0.0001. Data from four biological replicates were collected for each of the HT-mGFP conditions and five replicates were collected for each of the HT-mGFP-LC3B conditions. (C) Live cell imaging of ATG2 DKO cells stably expressing GFP-ATG2 that were transfected with Sar1bH79G-mOrange2 and starved for two hours. Note that GFP-ATG2A forms long tubules that do not colocalize with the Sar1bH79G-mOrange2 signal. Maximum intensity projection of a confocal image. Gray line was added to show cell outline. (D-E) Live cell imaging demonstrates the localization of ARFGAP1-TagRFP (D) and SNAP-Rab1a (E) on GFP-ATG2A/TagBFP-LC3B positive tubules following Sar1bH79G overexpression. Arrows denote thin GFP-ATG2A positive tubules whereas arrow heads denote thicker tubules that lack most GFP-ATG2A but contain high levels of LC3B, ARFGAP1, and Rab1a. Maximum intensity projections of confocal images. (F) CLEM-FIBSEM of cells prepared as in (C). GFP-ATG2A fluorescence corresponds to a thin tubular membrane that is connected to a thicker tubule. The small inset in the left image shows a single SEM slice. The turquoise arrow is pointing to the tubule which is segmented and displayed in turquoise in the larger image, whereas the yellow arrows are pointing at adjacent ER tubules which are segmented and displayed in the larger image in yellow. At many points, these ER structures come into very close apposition with the tubule which is denoted in red. The ER structures are removed in the right image for better visualization of the ATG2A positive tubule. Note that only the thin section has corresponding GFP-ATG2A fluorescence.
Figure 4.
Figure 4.. ATG2 deletion results in the accumulation of ARFGAP1 and Rab1a on autophagic membranes.
(A) Schematic of the membranes that accumulate at the ATG2 DKO compartment based off the TEM images in Olivas et al. The core of the compartment contains small vesicles that stain for ATG9A, LC3B, and P62. The periphery of the compartment is comprised of more complicated cup shaped membranes that stain for WIPI2. The entire compartment is enwrapped by ER tubules. (B) Immunofluorescence microscopy demonstrates that ARFGAP1 colocalizes with P62 in ATG2 DKO cells. Inset 1 highlights a cell undergoing mitosis, in which the colocalization of these two markers persists as denoted by the arrows. Inset 2 shows several cells, a ring-like accumulation of ARFGAP1 around P62 is clearly visible, separate from the Golgi. Maximum intensity projection of a confocal image. (C) Immunofluorescence images demonstrating the distribution of early secretory membranes around the ATG2 DKO compartment which is marked by either P62 (mouse antibody) or LC3B (rabbit antibody). The images presented are single confocal slices of the center of the ATG2 DKO compartment. The gray lines show the cell periphery and the insets focus on the largest accumulation of P62 or LC3B in the cell. (D) Quantification of the images in (C) and in Sup Fig 4A. The enrichment factor is equal to the mean of the given protein at the periphery of the ATG2 DKO compartment compared to its mean throughout the cell. Statistical significance was assessed by one way ANOVA. *, adjusted P value <0.05. **, adjusted P value <0.01. ***, adjusted P value <0.001. ****, adjusted P value <0.0001. Data from three biological replicates were pooled together for each of the conditions. (E-F) Immunofluorescence images demonstrating the enrichment of overexpressed GFP-Rab1a (E) or SNAP-Rab1a (F) at the periphery of the ATG2 DKO compartment as determined by the presence of P62 (E) or WIPI2 (F). Presented as a single confocal slice. The gray lines show the periphery of the cell and the insets focus on ATG2 DKO compartments that are distal from the Golgi.

References

    1. Melia T.J., Lystad A.H. & Simonsen A. Autophagosome biogenesis: From membrane growth to closure. J Cell Biol 219 (2020). - PMC - PubMed
    1. Osawa T. et al. Atg2 mediates direct lipid transfer between membranes for autophagosome formation. Nat Struct Mol Biol 26, 281–288 (2019). - PubMed
    1. Valverde D.P. et al. ATG2 transports lipids to promote autophagosome biogenesis. J Cell Biol 218, 1787–1798 (2019). - PMC - PubMed
    1. Maeda S., Otomo C. & Otomo T. The autophagic membrane tether ATG2A transfers lipids between membranes. Elife 8 (2019). - PMC - PubMed
    1. Osawa T., Ishii Y. & Noda N.N. Human ATG2B possesses a lipid transfer activity which is accelerated by negatively charged lipids and WIPI4. Genes Cells 25, 65–70 (2020). - PubMed

Publication types

LinkOut - more resources