[Preprint]. 2025 Mar 28:2025.03.24.645031.
doi: 10.1101/2025.03.24.645031.

T-World: A highly general computational model of a human ventricular myocyte

Affiliations

T-World: A highly general computational model of a human ventricular myocyte

Jakub Tomek et al. bioRxiv. .

Abstract

Cardiovascular disease is the leading cause of death, demanding new tools to improve mechanistic understanding and overcome limitations of stem cell and animal-based research. We introduce T-World, a highly general virtual model of human ventricular cardiomyocyte suitable for multiscale studies. T-World shows comprehensive agreement with human physiology, from electrical activation to contraction, and is the first to replicate all key cellular mechanisms driving life-threatening arrhythmias. Extensively validated on unseen data, it demonstrates strong predictivity across applications and scales. Using T-World we revealed a likely sex-specific arrhythmia risk in females related to restitution properties, identified arrhythmia drivers in type 2 diabetes, and describe unexpected pro-arrhythmic role of NaV1.8 in heart failure. T-World demonstrates strong performance in predicting drug-induced arrhythmia risk and opens new opportunities for predicting and explaining drug efficacy, demonstrated by unpicking effects of mexiletine in Long QT syndrome 2. T-World is available as open-source code and an online app.


Figures
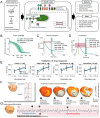
Figure 1.
Figure 1.. Cell and organ physiology.
A) Conceptual diagram of the T-World model and its potential applications. See Methods for a detailed diagram including all ionic currents and cellular compartments. B) Endocardial action potential of T-World versus experimental ranges . Slightly higher peak in simulation versus data was chosen, given that our model is a single cell, whereas the experimental data are in small tissue samples which show a reduced peak due to cell-to-cell coupling. C) Calcium transient (CaT) of T-World with highlighted biomarkers versus experimental ranges for: CaT duration at 90% recovery level (CaTD90, shown in green), time to peak (ttp, shown in yellow), and calcium transient amplitude (max, shown in red), based on standard error of mean ranges data by Coppini et al. D) Active tension developed by T-World with highlighted biomarkers versus experimental ranges for: time from peak to 95% recovery (rt95, shown in green), time to peak (ttp, shown in yellow), and maximum active tension (max, shown in red), based on Margara et al.. E) Independent validation of the APD prolongation or shortening induced by 1 μM E-4031 (70% IKr block), 1 μM HMR-1556 (90% IKs block), 1 μM nisoldipine (90% ICaL block), and 10 μM mexiletine (54% INaL, 9% IKr, 20% ICaL block) at 0.5, 1.0 and 2.0 Hz pacing in the four models. Drug concentrations and their effects on channel blocks are based on O’Hara et al. Please note the distinct y-axes for the four drugs. F) Healthy ventricular model constructed from clinical MRI data and ECG simulation (solid line) compared with the ECG record from the patient used for the ventricular anatomy. G) Ventricular fibrillation simulation in the setting of acute ischemia, when stimulation rate is progressively increased. Heart snapshots above the ECG illustrate different stages of progression towards fibrillation.
Figure 2.
Figure 2.. EADs, DADs, and alternans in T-World.
A) Experimental data showing EADs at 0.25 Hz pacing, with 85% block of IKr with dofetilide. B) EADs evoked in T-World under corresponding conditions. C) Demonstration of differential EAD formation under varying degrees of IKr availability in the following types of myocytes: male, female, and female + increased ICaL, reflecting the basal part of the heart in a rabbit study. The y-axis shows action potential duration for a range of IKr scaling factors (fraction of current versus baseline) on the x-axis, with sharp transitions corresponding to changes in the number of EADs. Insets show APs at corresponding dashed lines. D) Examples of triggered activity resulting from DADs. The end of the pre-pacing train is shown in blue, with the spontaneous activity given in red. E) Illustration of concurrent oscillations in CaT and APD. LL = large/long CaT and APD respectively, SS = small/short. F) Modulation of calcium alternans by reduced and increased SERCA activity, as well as by βAR stimulation.
Figure 3.
Figure 3.. S1-S2 restitution and stability of arrhythmic behaviours.
A) S1-S2 restitution curve in the T-World, ToR-ORd, Morotti2021, and TP06 models, and a range of human studies ,–. B) Comparison of S1-S2 restitution slopes across T-World, ToR-ORd, Morotti2021, and TP06 models. C) Positive relationship between APD of a cell and its peak S1-S2 restitution slope, observed experimentally . D) Corresponding simulation in T-World showing that when a range of ion channel conductances are varied (see Methods for details), cells with longer APD generally show a steeper slope of restitution. E) Steepening of restitution in female versus male myocytes in baseline T-World. F) Experimental human data comparing peak restitution slope in males vs females (N=7 in both groups, p-value obtained using unpaired t-test).
Figure 4
Figure 4. In silico drug safety and efficacy assessment.
A) Schematic of the in silico drug trial procedure, showing how pharmacological data on dose-dependent inhibition of various currents by cardioactive drugs are applied to calibrated populations of models. Subsequently, arrhythmogenic behaviours are detected, scored, and the prediction can be compared to reference clinical risk. B) Predicted risk scores for 61 drugs with, with color-coded clinical risk, as in ,. Tables of true/false classifications are provided in the right part for T-World and ToR-ORd. Please see Methods for a summary of how several data updates lead to a subtly different performance of ToR-ORd in our study compared to the original publication. C) Effect of the first lidocaine description (with INaL effect) on AP to the left, showing overall safety to the right (no model in the model manifests an EAD). D) Similar plot for the second lidocaine description available in the database, showing gradual dose-dependent APD prolongation to the left and repolarisation abnormalities to the right. In C, D, lidocaine effect is shown at the maximum concentration of 100x.
Figure 5.
Figure 5.. Arrhythmogenesis promotion by Type 2 diabetes and NaV1.8 current.
A) Comparison of APs of six distinct formulations of T2D remodelling (see Methods for details. B) Action potentials of control and T2D models across a range of IKr multipliers (on y-axis). Sharp transitions between colours indicate a change in the presence of an EAD. Specifically, the lowest teal point on the y-axis (APD of ca. 900) indicates the highest IKr availability which supports EAD formation. C) The same type of visualisation showing how single elements of T2D remodelling considered throughout D1-D6 models, added to the control model, alter EAD vulnerability. The ‘+CaMKII’ column also involves an increase in INaL, as described in Methods, and ‘-ICaL’ corresponds to 80% ICaL density compared to control model. D) Comparing alternans vulnerability (slowest pacing rate which induces CaT alternans) between population of control vs T2D models. The calibrated population of 796 models used in Results: Stability of arrhythmic behaviours was used as the control population, with T2D models created by adding diabetic remodelling to each of those models. E) A scatterplot of tau of mechanical relaxation versus alternans threshold in the simulated T2D population F) Comparing control T-World model AP to APs obtained when two different amounts of NaV1.8 current are added (expressed as relative percentage of peak INa).

References

    1. Natalia A Trayanova Aurore Lyon, Shade Julie & Heijman Jordi. Computational modeling of cardiac electrophysiology and arrhythmogenesis: toward clinical translation. Physiol Rev 104, 1265–1333 (2024). - PMC - PubMed
    1. Boyle P. M. et al. Computationally guided personalized targeted ablation of persistent atrial fibrillation. Nat Biomed Eng 3, 870 (2019). - PMC - PubMed
    1. Passini E. et al. Human In Silico Drug Trials Demonstrate Higher Accuracy than Animal Models in Predicting Clinical Pro-Arrhythmic Cardiotoxicity. Front Physiol 12, 668 (2017). - PMC - PubMed
    1. Tomek J. et al. Development, calibration, and validation of a novel human ventricular myocyte model in health, disease, and drug block. Elife 8, e48890 (2019). - PMC - PubMed
    1. Passini E. et al. The virtual assay software for human in silico drug trials to augment drug cardiac testing. J Comput Sci 52, 101202 (2021).

Publication types