[Preprint]. 2025 Mar 25:2025.03.25.644866.
doi: 10.1101/2025.03.25.644866.

PTRAMP, CSS and Ripr form a conserved complex required for merozoite invasion of Plasmodium species into erythrocytes

Affiliations

PTRAMP, CSS and Ripr form a conserved complex required for merozoite invasion of Plasmodium species into erythrocytes

Benjamin A Seager et al. bioRxiv. .

Abstract

Invasion of erythrocytes by members of the Plasmodium genus is an essential step of the parasite lifecycle, orchestrated by numerous host-parasite interactions. In P. falciparum Rh5, with PfCyRPA, PfRipr, PfCSS, and PfPTRAMP, forms the essential PCRCR complex which binds basigin on the erythrocyte surface. Rh5 is restricted to P. falciparum and its close relatives; however, PTRAMP, CSS and Ripr orthologs are present across the Plasmodium genus. We investigated PTRAMP, CSS and Ripr orthologs from three species to elucidate common features of the complex. Like P. falciparum, PTRAMP and CSS form a disulfide-linked heterodimer in both P. vivax and P. knowlesi with all three species forming a complex (PCR) with Ripr by binding its C-terminal region. Cross-reactive antibodies targeting the PCR complex differentially inhibit merozoite invasion. Cryo-EM visualization of the P. knowlesi PCR complex confirmed predicted models and revealed a core invasion scaffold in Plasmodium spp. with implications for vaccines targeting multiple species of malaria-causing parasites.

Keywords: CSS; P. cynomolgi; P. falciparum; P. knowlesi; P. vivax; PTRAMP; Ripr; erythrocytes; invasion complex; malaria.


Conflict of interest statement

Competing interests The authors have no conflicts of interest to declare.

Figures

Extended Data figure 1.
Extended Data figure 1.. AlphaFold 3 predicts a PTRAMP, CSS, Ripr complex for all major clades of Plasmodium.
a-d. AlphaFold 3 predictions of PTRAMP, CSS and Ripr from several species of Plasmodium. Top row: Models colored by confidence (pLDDT). Bottom row: models colored as follows: PTRAMP (pink), CSS (green) and Ripr (yellow). The prediction for P. falciparum shows the alignment with full length Ripr, where the core forms an ordered structure. Predicted alignment error (PAE) plot is shown as inset. All models have transmembrane domains and signal peptides omitted for clarity.
Extended Data figure 2.
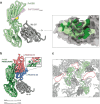
Extended Data figure 2.. Comparison of PvCSS crystal structure with PfCSS structures.
a. Binding interface between nanobody D7 and PvCSS. The detail shows the entire interface. PvCSS is grey and the region of D7 binding is shown in pale green, with hydrogen bonds and salt bridges shown in forest green. Regions of D7 involved in the interaction are shown and consist of complementarity determining regions (CDR) and framework regions (FR). Regions of D7 not involved in binding are omitted for clarity. b. Overlay of PfCSS-H2 (H2 in red) and PfCSS-D2 (D2 in blue) crystal structures with PvCSS-PvPTRAMP-D7(D7 in grey) crystal structure. Inset shows PvPTRAMP42–53 occupies the same region as the CDR3 loop of H2, explaining how it competes with PfPTRAMP binding to PfCSS. c. Crystal packing of PvCSS-PvPTRAMP-D7. The asymmetric unit is shown in color (PvCSS in green, PvPTRAMP in pink and D7 in dark grey) and other symmetry related copies in light grey. Red circles show pockets within the crystal lattice that are adjacent to the C-terminal (CT) of PvPTRAMP42–53 that likely accommodate the GFD and TSR domains of PvPTRAMP.
Extended Data figure 3.
Extended Data figure 3.. The PvPCR complex can be reconstituted in vitro using recombinant proteins.
a. Representative SDS-PAGE of recombinant full-length PvRipr. b. Representative biolayer interferometry sensorgram of PvRipr vs PvPC. Data are in yellow and 1:1 model best fit in black. c. Mass distribution plots of PvPC (pink) and PvRipr (yellow) as determined by mass photometry. Histogram data are in color and the Gaussian curve fit in black. d. Size-exclusion chromatography of PvPC (pink), PvRipr (yellow) and PvPCR (grey), with SDS-PAGE results of the co-complexation, showing co-elution of PvPC and PvRipr.
Extended Data figure 4.
Extended Data figure 4.. Biophysical analysis of PkPC and PkRipr.
a. SDS-PAGE of recombinant full-length PkRipr. b. Representative biolayer interferometry sensorgram of PkRipr vs PkPC. Data are in yellow and 1:1 model best fit in black. c. Mass distribution plots of PkPC (pink) and PkRipr (yellow) as determined by mass photometry. Histogram data are in color and the Gaussian curve fit in black.
Extended Data figure 5.
Extended Data figure 5.. Biophysical analysis of Ripr truncations.
a. SDS-PAGE of recombinant PfRipr truncations and representative biolayer interferometry sensorgrams of Ripr truncations vs PfPC. PfRiprtail and PfRiprEGF 9,10,CTD harbor T966A and S1023A mutations and PfRiprCTD harbors S1023A mutation. b. SDS-PAGE of recombinant PvRipr truncations and representative biolayer interferometry sensorgrams of Ripr truncations vs PvPC. c. SDS-PAGE of recombinant PkRipr truncations and representative biolayer interferometry sensorgrams of Ripr truncations vs PkPC. For all sensorgrams, data are in color and 1:1 model best fit in black where applicable. Schematics of the Ripr truncations are shown above.
Extended Data figure 6.
Extended Data figure 6.. Serological assessment of invasion antigens.
Antibody kinetics in longitudinal plasma samples collected from individuals with P. falciparum (yellow), P. vivax (light blue), P. knowlesi (dark blue) infections at three timepoints (current (n=95), week 1 (n=98) and a month (n=98)) on a logarithmic scale. Samples from Volunteer Biospecimen Donor Registry (white, n =28) and Thailand Red Cross (light grey, n = 29) was used to set the sero-positivity cut-off (red dotted line), which is mean of these samples + 2 x standard deviation. Samples from healthy (non-febrile) individuals from Sabah Malaysia (dark grey, n=30) are not included in the sero-positivity calculation as their previous exposure status to any of the Plasmodium species is unknown. Boxplots display the median (horizontal line), interquartile range (IQR) (the box), largest and smallest values (1.25 x IQR, whiskers) and outliers are displayed as points.
Extended Data figure 7.
Extended Data figure 7.. Characterization of anti-PvPC mouse monoclonal antibodies.
a. Competition binning of anti-PvPC monoclonal antibodies and PvRipr. b. Representative biolayer interferometry sensorgrams of antibody binding to PvPC, PkPC, and PfPC. Data are in color and 1:1 model best fit in black. c. Table of KD values, in nM, for the curves in b. N.D = not determined
Extended Data figure 8.
Extended Data figure 8.. Characterization of anti-PvRipr mouse monoclonal antibodies.
a. SDS-PAGE of recombinant PvRiprEGF6–8. b. Biolayer interferometry sensorgram of PvRiprEGF6-8 vs PvPC showing no interaction between the two proteins. c. Competition binning of anti-PvRipr antibodies. d. Representative biolayer interferometry sensorgrams of antibody binding to PvRipr, PkRipr and PfRipr. The anti-PfRipr antibody 1G12 was included as a control . Data are in color and 1:1 model best fit in black. e. Table of KD values, in nM, for the curves in d. N.D. = not determined.
Extended Data figure 9.
Extended Data figure 9.. Negative stain electron microscopy of PkPCRtail+5B3 Fab shows an elongated structure.
a. Size-exclusion chromatography chromatograph of PkPCRtail and PkPCRtail+5B3 Fab. b. Non-reducing SDS-PAGE of peak fractions of purified complexes from a. 5B3 Fab and Riprtail have approximately the same molecular weight. c. Representative electron micrograph of negatively stained PkPCRtail+5B3 Fab particles. d. Two-dimensional class averages of PkPCRtail+5B3 Fab. White arrows show density attributable to 5B3-Fab.
Extended Data figure 10.
Extended Data figure 10.. PvPC, PkPC and PkPCR do not bind erythrocytes.
a. Representative flow cytometry plots of PkPC, PkRipr, and PkPCR incubated with erythrocytes and detected with either anti-PC or anti-Ripr antibodies. PfRh5 was used as a positive control for erythrocyte binding. b. Quantitation of binding events from three independent experiments. Individual experimental replicates are depicted as colored dots, and the mean is shown with standard error of the mean (SEM). c. Representative flow cytometry plots of PvPC and PkPC incubated with reticulocyte enriched cord blood and detected with anti-PC antibody. PvRBP2b was used as a positive control for reticulocyte binding. d. Quantitation double positive binding events of three independent experiments. Individual colored dots represent a replicate performed with a single donor’s blood. Mean is shown with SEM.
Fig. 1.
Fig. 1.. PTRAMP, CSS, and Ripr are common to all clades of Plasmodium.
a. Comparison of PCRCR orthologs in the Plasmodium genus, showing that PTRAMP, CSS, and Ripr are common to all species, whereas Rh5 is restricted to the Laverania subgenus, and CyRPA is absent from the rodent-infective species (Vinckeia). b. AlphaFold 3 predictions of PTRAMP, CSS, and the Ripr tail show a conserved architecture is predicted for each species. For the P. falciparum predicted complex, the previously published structure for PfCSS is superimposed in dark green. Regions that are predicted to be disordered, and therefore have low model confidence, are shown as transparent. The transmembrane domain and signal peptide have been removed from PTRAMP and CSS for clarity c. Domain diagrams for PfPTRAMP, PfCSS and PfRipr showing the predicted N-linked glycosylation sites (blue) that were either mutated (red) or the sequon truncated (grey). Grey regions indicate the stretches of sequence either processed (signal peptides) or removed for recombinant expression, in the case of PfPTRAMP (transmembrane domain and cytoplasmic tail). d. SDS-PAGE of non-glycosylated PfPC in both non-reduced (NR) and reduced (R) conditions. e. A representative biolayer interferometry sensorgram of non-glycosylated PfRipr binding to non-glycosylated PfPC showing data (yellow) and 1:1 model best fit (black).
Fig. 2.
Fig. 2.. Structure of the intermolecular disulfide bond between PvCSS and PvPTRAMP.
a. SDS-PAGE of recombinantly expressed PvPTRAMP, PvCSS and PvPC heterodimer. b. Domain diagram of PvCSS showing the disordered repeat region at the N-terminus. c. Crystal structure of PvCSS115–381(green) and PvPTRAMP42–53(pink) with the disulfide formed between them in space-filling atomic depiction (yellow). d. Detail of the intermolecular disulfide bond between PvCSS and PvPTRAMP. Density is contoured at 1.0 σ and density extends to a range of 1.8 Å. e. A model of PvCSS and PvPTRAMP42–53, showing the region of the unbiased electron density omit map that was attributed to PvPTRAMP. Density is represented as in d). f. The interface between PvPTRAMP42–53 and PvCSS. All intermolecular hydrogen bonds formed are represented in grey.
Fig. 3.
Fig. 3.. The PvPC heterodimer forms a stable complex with PvRipr.
a., b. and c. Representative biolayer interferometry sensorgrams of PvPC, PvPTRAMP, PvCSS, and PvRipr binding assays. Dilution series data are shown in color and 1:1 model best fit is shown in black. Representative sensorgrams of PvPTRAMP, PvRipr and PvPC binding to PvCyRPA at an analyte concentration of 5 μM. Data could not be reliably fit with a model, and so no best fit has been shown. e. Mass distribution of PvPC and PvRipr after pre-incubation as measured by mass photometry. Histogram data are shown in grey and Gaussian curve fit in black.
Fig. 4.
Fig. 4.. A small region of Ripr is sufficient for PTRAMP-CSS binding in P. falciparum, P. vivax, and P. knowlesi.
a. SDS-PAGE of recombinantly expressed PkPTRAMP, PkCSS and PkPC heterodimer b-d. Representative biolayer interferometry sensorgrams of PkPC, PkPTRAMP, PkCSS and PkRipr binding assays. Dilution series data are shown in color and 1:1 model best fit is shown in black. e. Mass distribution of PkPC and PkRipr after pre-incubation as measured by mass photometry. Histogram data are shown in grey and Gaussian curve fit in black. f. The ability of Ripr and Ripr truncations to bind to PTRAMP-CSS in P. falciparum, P. vivax and P. knowlesi. The table shows the truncations used and their dissociation constant (KD, in nM, with standard error of the mean (SEM)) for binding their cognate heterodimer. N.B indicates no binding.
Fig. 5.
Fig. 5.. Cross-reactive antibodies targeting PTRAMP, CSS, and Ripr exhibit differential inhibition in multiple species of Plasmodium.
a. IgG antibodies in human patients with Plasmodium infections. Fold-change peak week one antibody response relative to the seropositivity cut-off (mean of negative controls + 2x standard deviation). The panels are facetted by species of the recombinant protein (P. falciparum, P. knowlesi and P. vivax). The colored dots represent the plasma samples in which the proteins were assayed. b. Purified mouse monoclonal antibodies mapped by binding region. Open text represents antibodies that are able to bind both P. vivax and P. knowlesi, and closed text represents cross-reactivity between P. vivax, P. knowlesi and P. falciparum. Bold line indicates that 4H10 blocks PvPC binding to Ripr c. P. knowlesi growth inhibition assay of anti-PvPC and anti-PvRipr biologics. The non-inhibitory and PfCSS nanobody H2 was included as a negative control. Three independent experiments were performed, and the mean and SEM are shown in black. Antibodies and nanobodies were tested at a final concentration of 0.5 mg/mL. Data points are colored according to antigen, with CSS in green, PTRAMP in pink and Ripr in yellow d. Growth inhibition dilution series for inhibitory antibodies in P. knowlesi. Growth inhibition (%) is the mean of four independent experiments. Error bars represent standard deviation. e. Growth inhibition dilution series for inhibitory antibodies in P. falciparum. Growth inhibition (%) is the mean of four independent experiments for 5B3, and two independent experiments for 4E2 and 4H10. Error bars represent standard deviation. f. Ex vivo growth inhibition assay of P. vivax parasites. Antibodies were tested at a final concentration of 0.5 mg/mL. Anti-Duffy antigen receptor for chemokines (DARC) mouse monoclonal antibody 2C3 was used as a positive control. Data are from six independent experiments. Error bars show mean and SEM. Data points colored as in c. g. P. cynomolgi growth inhibition assay of anti-PvPC and anti-PvRipr antibodies. Antibodies were tested at a final concentration of 0.5 mg/mL. Three independent experiments were performed, and the mean and SEM are shown in black. Data points are colored as in c.
Fig. 6.
Fig. 6.. PTRAMP, CSS, and Ripr form a core invasion scaffold in Plasmodium spp.
a. Cryo-EM 2D class averages of the PkPCRtail complex. Addition of the 5B3 Fab fragment shows distinct density at the end of the Ripr tail (white triangle). Inset shows the PkPCRtail complex colored according to the predicted model b. AlphaFold 3 predicted model (left) and diagram (right) of PkPCRtail. Transmembrane domains, signals sequences and large disordered regions have been omitted for clarity. Inset shows the alignment of the PvPC (purple and dark green) structure and the PkPC predicted structure (pink and light green) c. Model of the PCRCR complex of P. falciparum and PCR complexes of P. vivax, and P. knowlesi. PTRAMP, CSS and Ripr form a conserved three-membered complex that serves as a scaffold for an invasion complex. In P. falciparum this complex involves CyRPA and Rh5. In P. vivax and P. knowlesi this complex likely contains other components (dashed grey) that have yet to be identified, which engage with the erythrocyte membrane via host-cell specific receptors.

References

    1. Weiss DJ, Lucas TCD, Nguyen M, et al. Mapping the global prevalence, incidence, and mortality of Plasmodium falciparum, 2000–17: a spatial and temporal modelling study. Lancet. Jul 27 2019;394(10195):322–331. doi:10.1016/s0140-6736(19)31097-9 - DOI - PMC - PubMed
    1. Battle KE, Lucas TCD, Nguyen M, et al. Mapping the global endemicity and clinical burden of Plasmodium vivax, 2000–17: a spatial and temporal modelling study. The Lancet. 2019;394(10195):332–343. doi:10.1016/S0140-6736(19)31096-7 - DOI - PMC - PubMed
    1. Singh B, Kim Sung L, Matusop A, et al. A large focus of naturally acquired Plasmodium knowlesi infections in human beings. Lancet. Mar 27 2004;363(9414):1017–24. doi:10.1016/s0140-6736(04)15836-4 - DOI - PubMed
    1. Cox-Singh J, Davis TM, Lee KS, et al. Plasmodium knowlesi malaria in humans is widely distributed and potentially life threatening. Clin Infect Dis. Jan 15 2008;46(2):165–71. doi:10.1086/524888 - DOI - PMC - PubMed
    1. Galinski MR, Medina CC, Ingravallo P, Barnwell JW. A reticulocyte-binding protein complex of Plasmodium vivax merozoites. Cell. 1992/06/26/ 1992;69(7):1213–1226. doi:10.1016/0092-8674(92)90642-P - DOI - PubMed

Publication types

LinkOut - more resources